A site can pass every uptime check for months while getting steadily, noticeably slower the entire time — because “technically responding” and “responding at a reasonable speed” are two completely different bars, and standard uptime monitoring only ever checks the first one. A response that takes six seconds still counts as “up.” It just also happens to be losing you visitors the whole time.
Uptime monitoring answers a single, binary question: did the server respond. It’s a genuinely important question, but it’s also a low bar — a site groaning under server resource pressure, or weighed down by a heavy plugin someone installed six months ago and forgot about, will keep passing uptime checks the entire time it’s quietly getting worse for every real visitor trying to use it.
The same five-minute HTTP check behind uptime monitoring also records response time on every check, building a real trend of how quickly a site actually responds over time through performance monitoring. One slow response means little in isolation. A response time steadily climbing over days or weeks is a genuinely useful early warning, visible well before it turns into an actual outage.
“Your site feels slow lately” is a subjective, easily dismissed observation. A chart showing response time climbing steadily over eight weeks is concrete evidence, and it changes the shape of a hosting-upgrade conversation with a client entirely — from a vague impression they might push back on, to a documented trend they can see for themselves, making the recommendation far easier to accept.
A site’s response time crept from under a second to nearly four seconds over six weeks, with uptime checks passing the entire time — nothing about it ever registered as an outage. The trend line made the pattern obvious well before it became a real problem: a new plugin installed around the same window turned out to be running an unoptimized database query on every page load. Removing it brought response time back down immediately. Without the trend data, the same issue likely wouldn’t have surfaced until the site finally buckled under real load and the outage itself became the first signal anyone noticed.
A healthy performance trend isn’t necessarily flat — some natural variation day to day is completely normal, tied to traffic patterns and routine server activity. What’s worth watching for isn’t variation itself, but a consistent directional drift over a longer window, where each week’s average response time is a bit slower than the last. That specific shape, not any single data point, is the signal worth acting on.
No — it’s a continuous record of response times over time, not a single point-in-time speed check run once.
No — the same monitoring process that confirms uptime also tracks performance, in one unified system rather than two.
Start a free 14-day trial — no credit card required.
A backup is supposed to run every night at 2am. You believe it’s running because nothing’s ever complained otherwise — right up until the day you actually need that backup and discover it hasn’t succeeded in three weeks. Automation you can’t see into is automation you’re trusting blindly, and blind trust in backups specifically is exactly the kind of thing that turns a bad day into a genuinely terrible one.
The whole appeal of automating maintenance work is not having to think about it. The risk is exactly the same thing: if a scheduled task silently starts failing, “not having to think about it” quietly becomes “not knowing it’s broken,” and there’s often no natural moment that forces you to find out until the task’s absence actually matters.
Every backend engine in WP Warden — from uptime monitoring to malware scanning to backup scheduling — writes entries to the system log as it runs, recording a severity level, a source, and a clear message describing what happened. It’s genuinely human-readable, written to be understood by someone who isn’t a developer, rather than raw technical output that requires expertise to interpret.
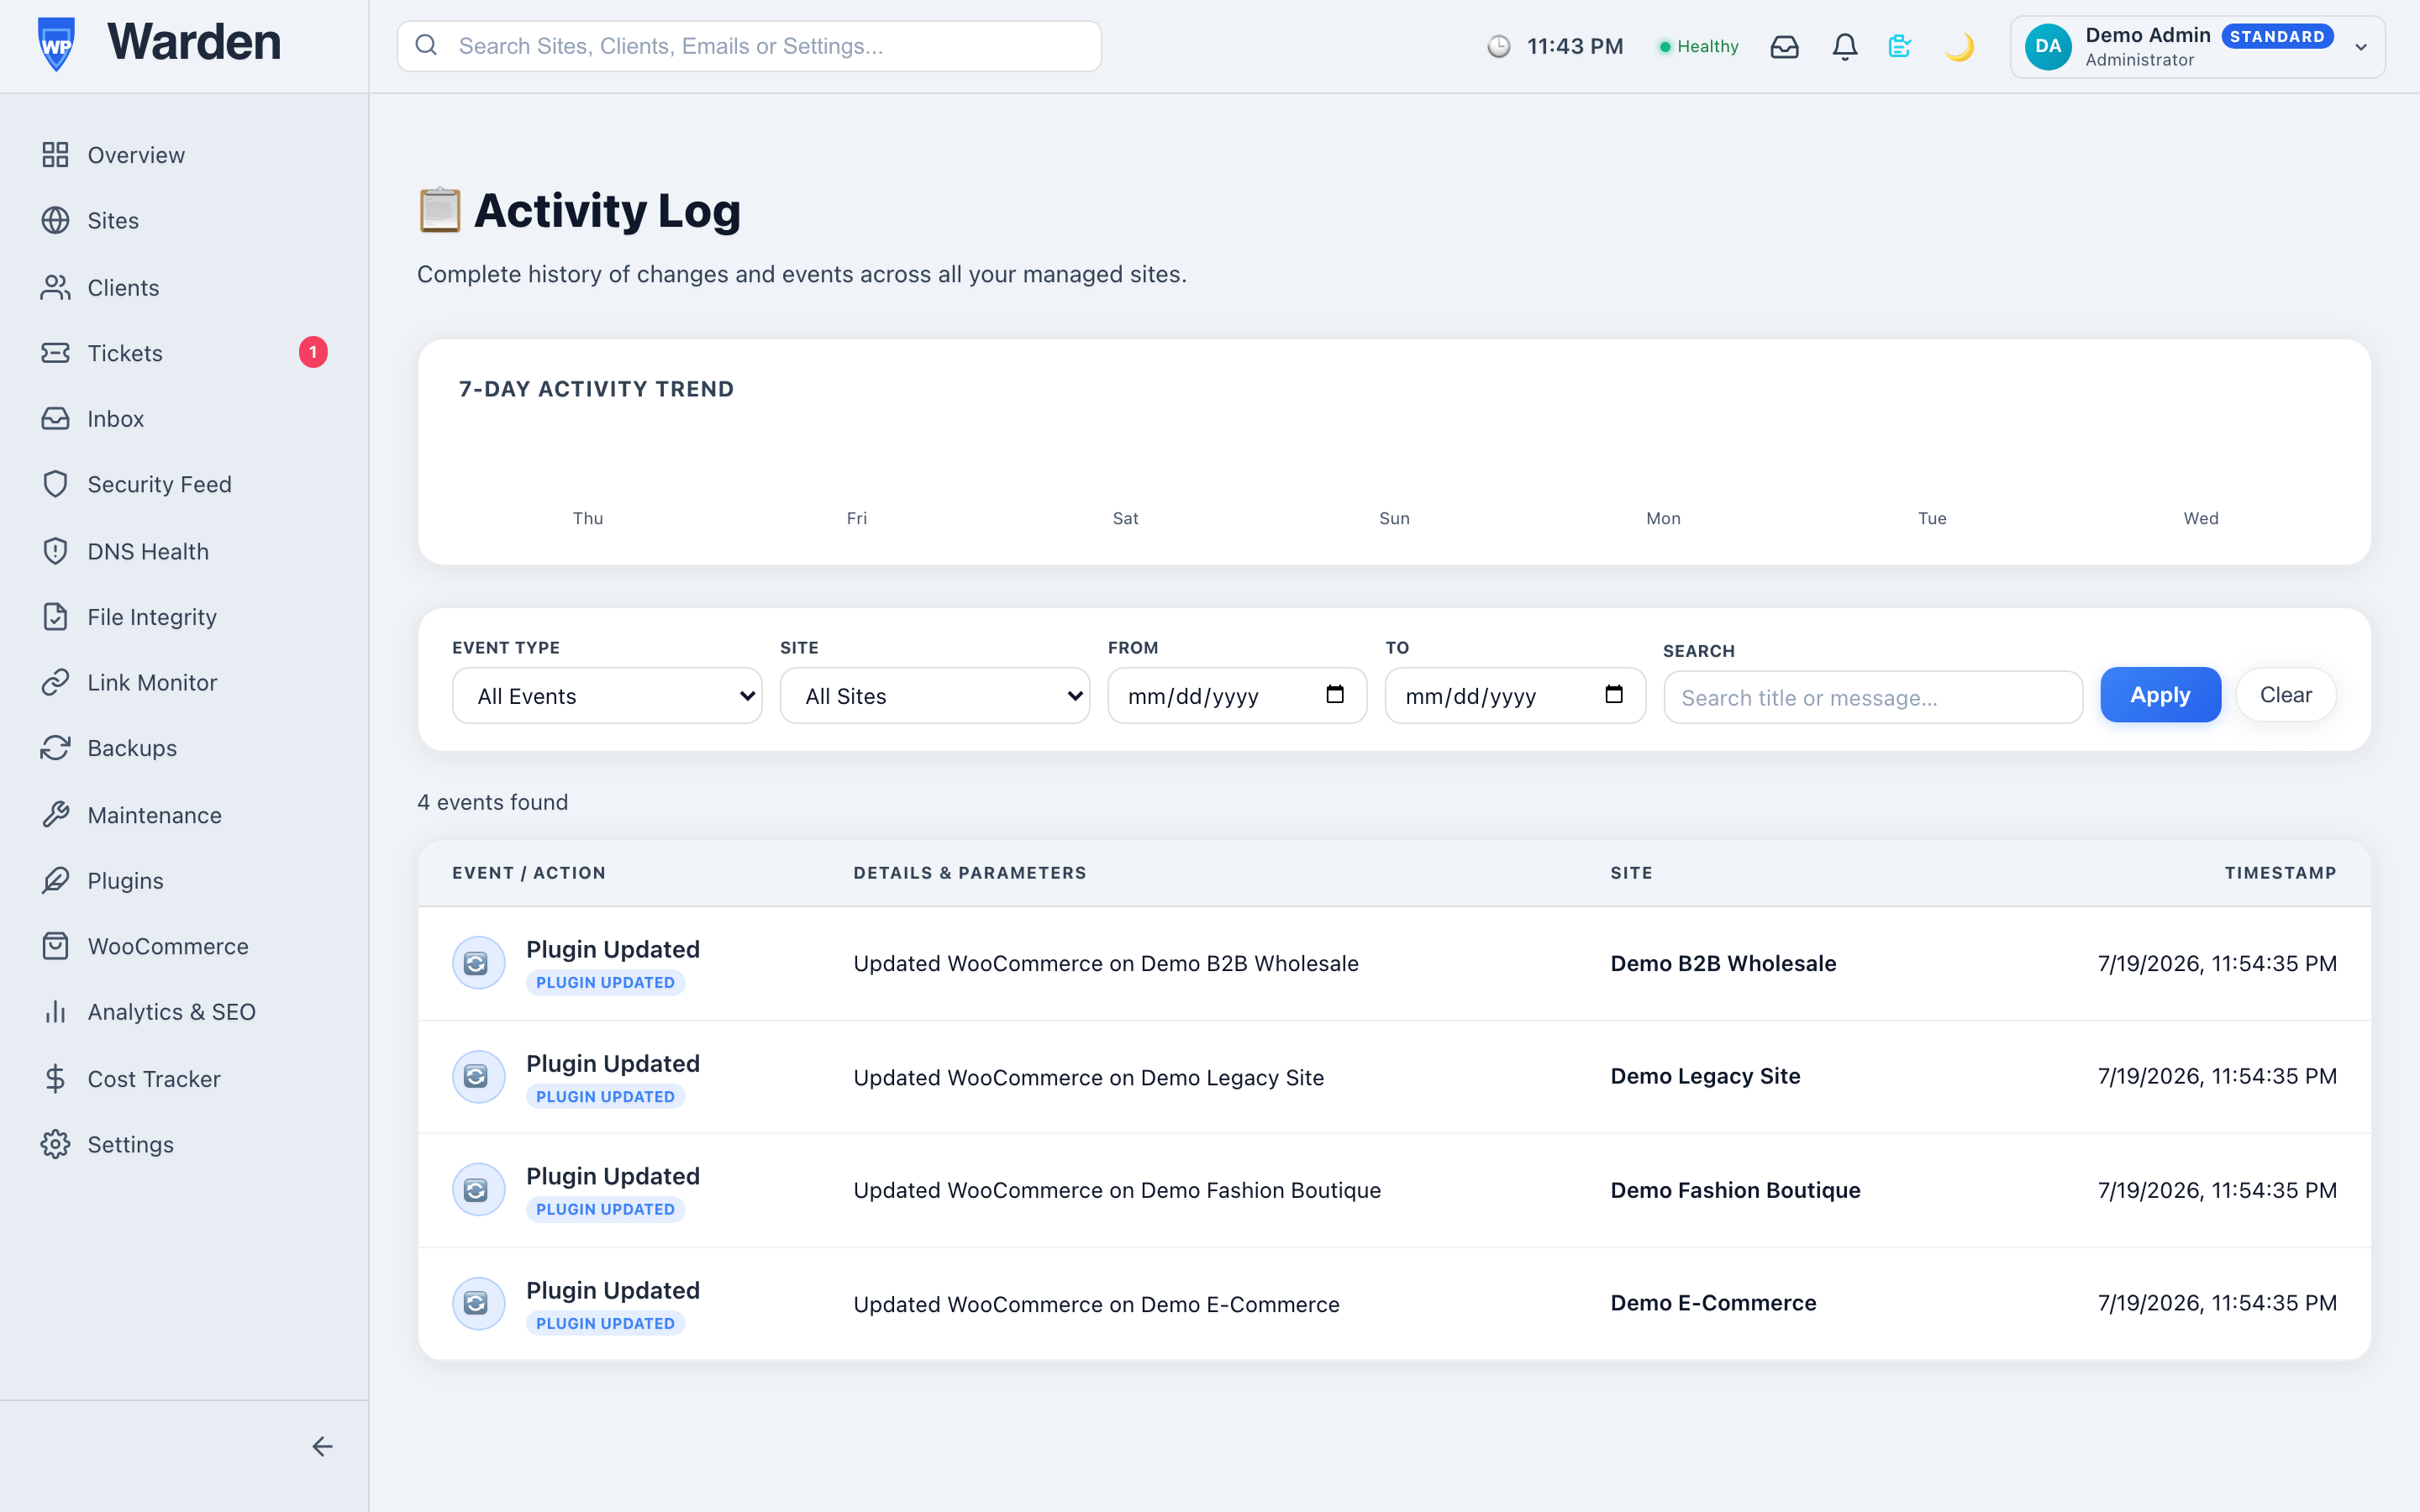
It’s worth being clear about the distinction, because the two logs solve related but genuinely different problems. The activity audit log answers “which person did this” — it covers human actions. System logs answer “what did the automation actually do” — they cover the machine’s own side of the work. Together they cover every category of change that can happen to a site, with neither one able to substitute for the other.
A client asks why their last two backups seem smaller than usual. Instead of guessing, the system log for that site shows exactly what happened during each backup run — which files were included, whether anything was skipped, and why. What might otherwise be an hour of speculative troubleshooting becomes a two-minute lookup, because the answer was already being recorded the whole time, just waiting to be checked.
In practice, most people rarely open the system log at all during a normal week — and that’s the point. It exists for the specific moments something seems off and needs a real answer, not as a feed anyone is expected to read constantly. Its value is in being there, complete and readable, exactly when it’s finally needed.
No — it’s fully visible from the dashboard, in plain readable language rather than raw server output.
No — system logs cover automated background engines; the audit log covers actions taken by human users. They’re complementary, not overlapping.
Start a free 14-day trial — no credit card required.
A site goes down at 3am and comes back on its own by 3:20. Nobody was awake for either event, and by morning the alert list has one more open item that’s technically already resolved — except the dashboard doesn’t know that yet, and now someone has to manually confirm and close it before the list feels trustworthy again. Multiply this across a real fleet and it’s a genuinely tedious daily chore that adds nothing.
A fleet with any real number of sites will always have a background rate of brief, self-correcting blips — a momentary network issue, a passing server load spike. None of these need human intervention to actually fix. All of them, without auto-resolution, need human intervention to close, which means real time spent every single day confirming that things which already fixed themselves are, in fact, fixed.
When a later check confirms the condition behind an alert no longer exists — a site that was down is back online, a link that was broken responds again — WP Warden’s auto-resolution engine closes it automatically and logs the resolution with a timestamp. The key word is confirms: this isn’t a timer that assumes things are fine after a while, it’s a real follow-up check that has to actually pass before anything closes.
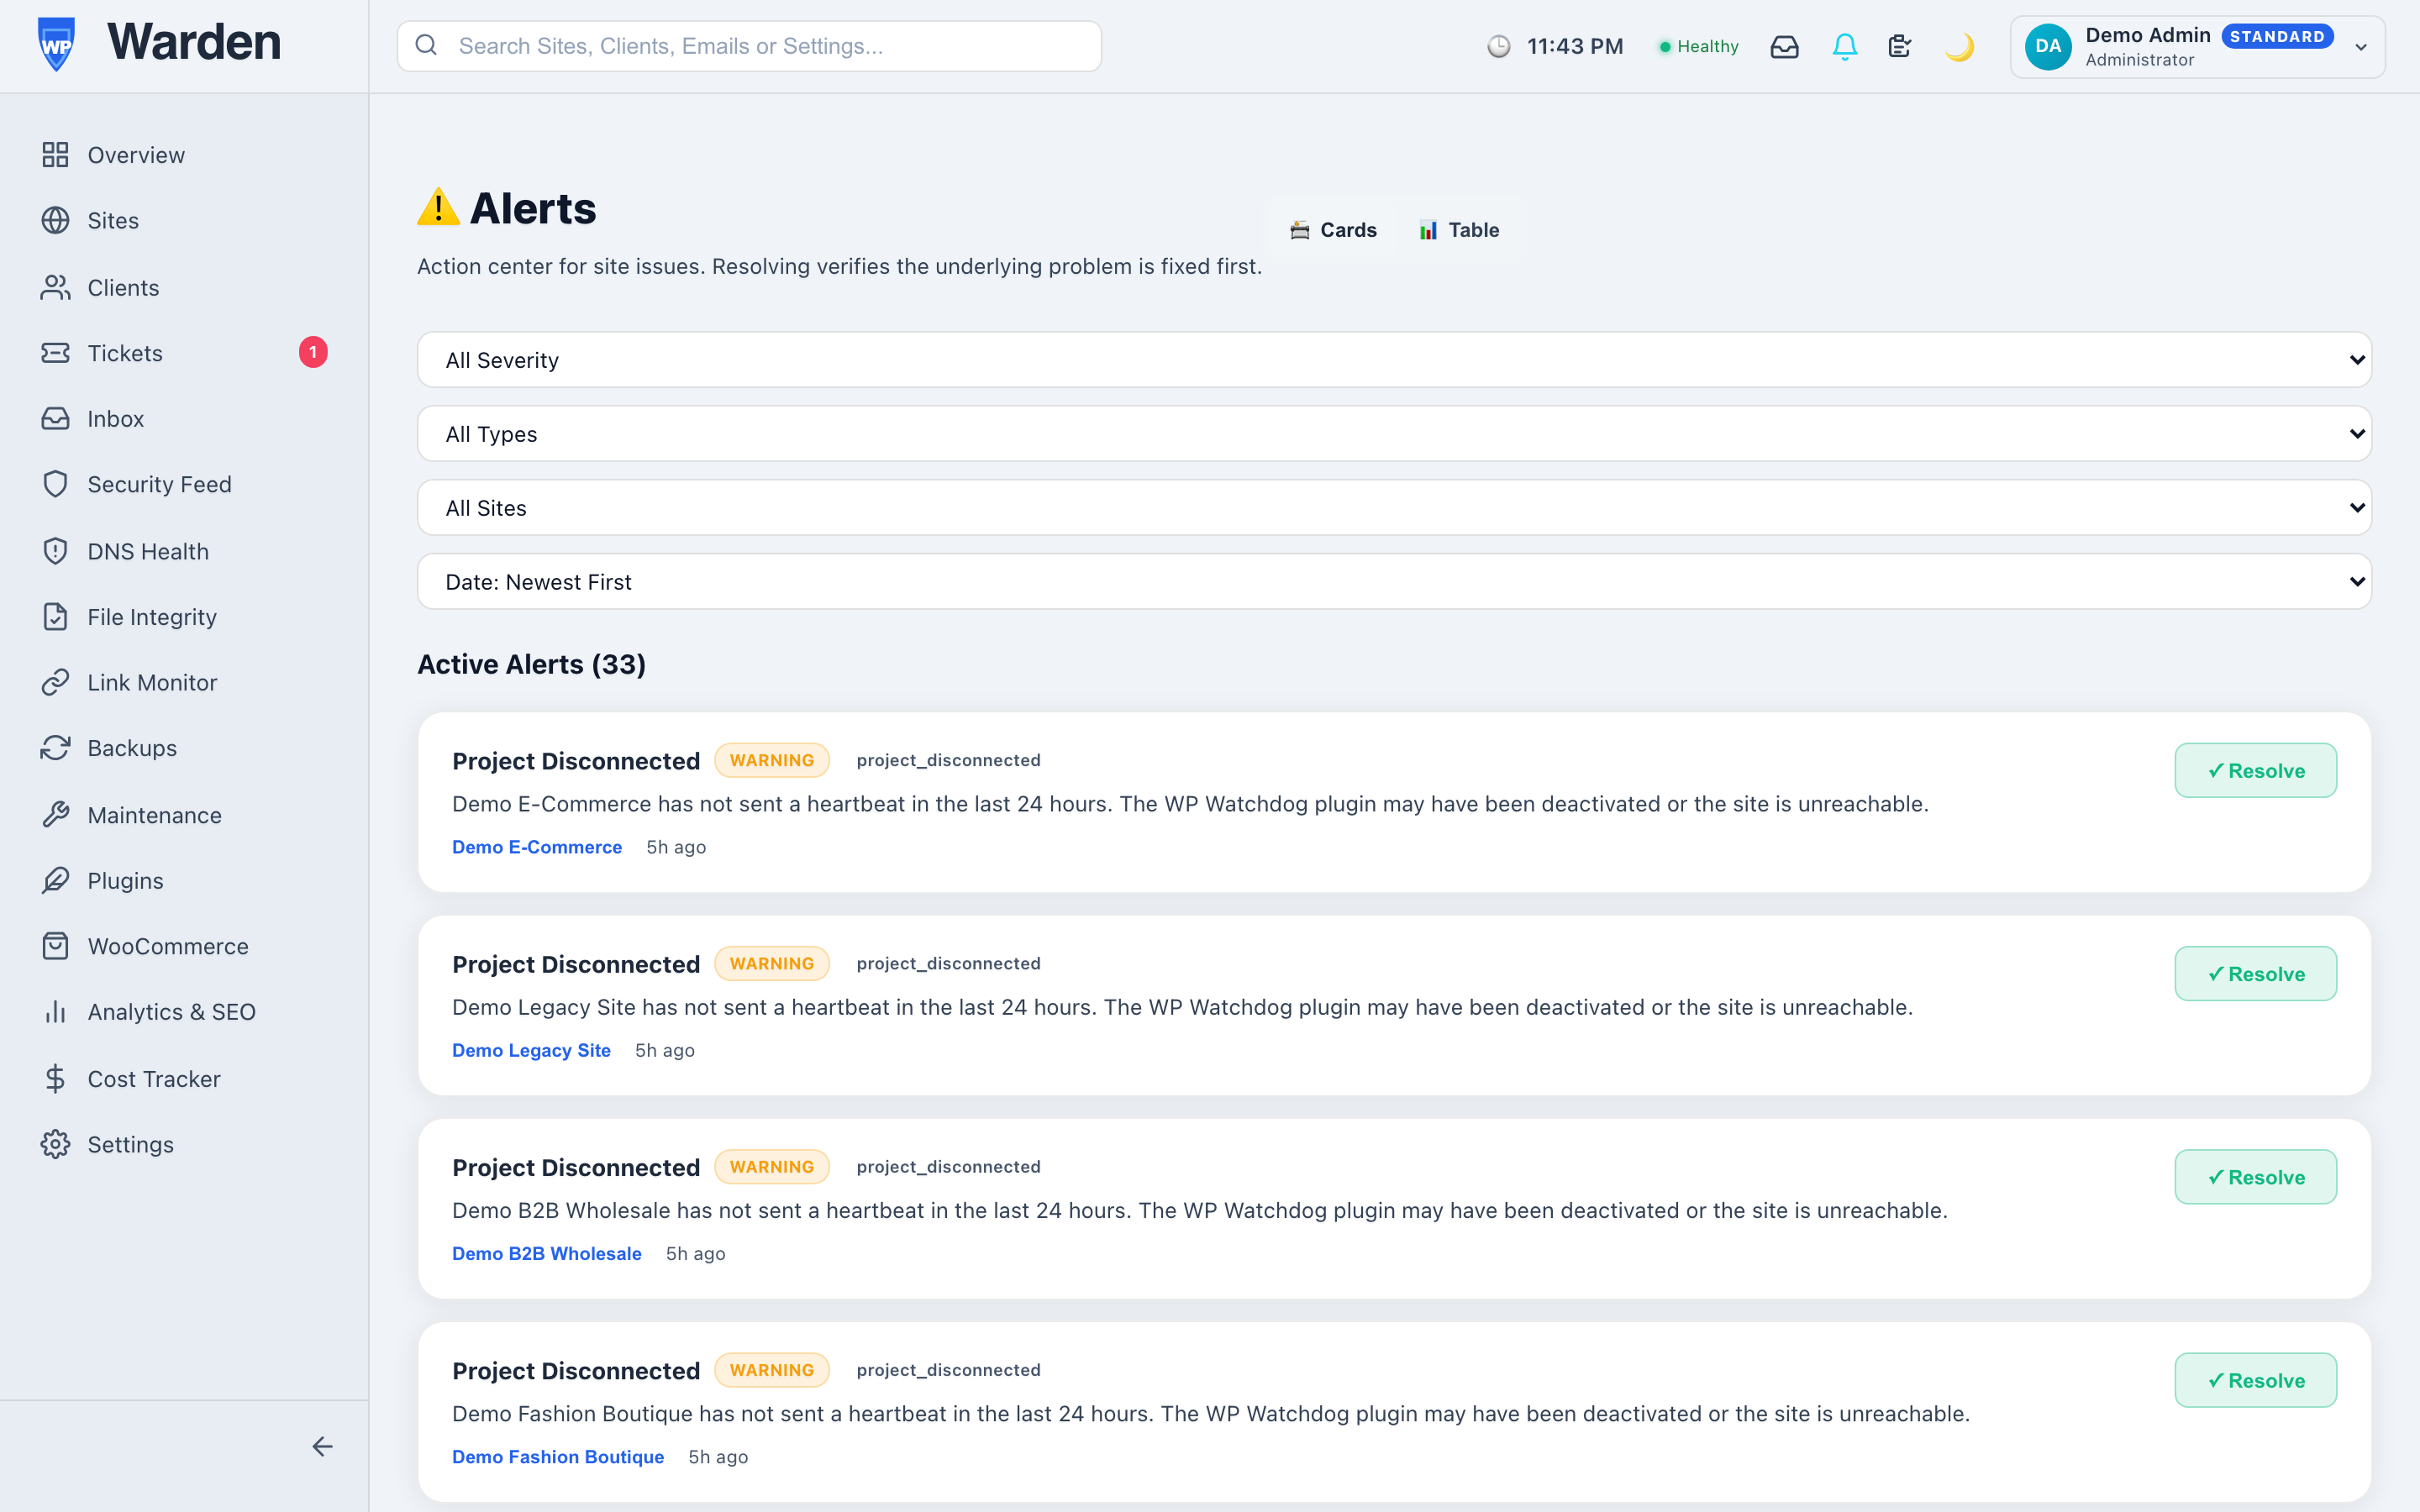
Some categories of alert are never candidates for auto-resolution, on purpose — a malware scan finding being the clearest example. “The file looks clean on a second scan” is not the same kind of confirmation as “the site responded to a HEAD request,” and treating it the same way would be a genuine safety regression rather than a convenience. Those alerts always wait for a person to actually look at them, regardless of how much time has passed.
Automatic anything involving alerts tends to make people nervous, reasonably — the fear is always a real problem getting silently swept under the rug. The design here is deliberately conservative specifically to address that: nothing closes without a genuine follow-up check confirming the original condition, and entire categories of finding are permanently excluded from ever auto-closing at all. The result is a system that saves real time on the genuinely low-stakes cases, while never touching the cases where a false sense of resolution would actually be dangerous.
Every auto-resolved alert leaves behind a real record — when it was originally raised, when it was confirmed resolved, and how long the underlying condition actually lasted. That means the convenience of not having to manually close it doesn’t come at the cost of losing the history entirely; the full incident is still there to review later if a pattern of repeated brief outages on the same site is ever worth investigating.
No — anything requiring real human judgment is deliberately excluded and always waits for manual review, regardless of any follow-up check.
No — only when an actual follow-up check verifies the original condition is genuinely resolved, not on any kind of timer.
Start a free 14-day trial — no credit card required.
Somewhere around client number thirty, a lot of agencies notice the same thing: half their staging domains follow the same naming convention, and picking the right one out of a plain text list means actually reading each one carefully instead of just recognizing it. At small scale that’s a non-issue. At real scale, it’s a surprisingly consistent source of small, avoidable mistakes.
Human visual recognition is genuinely faster than reading for this specific task — most people can pick a familiar face or a familiar image out of a grid faster than they can read and compare a list of similar strings. A fleet list of domain names asks you to do the slower thing constantly, dozens of times a day, purely because nobody built the faster option into the tool.
A real screenshot of each site’s homepage is captured automatically and shown in the fleet list, via site screenshots — the same screenshot engine that powers visual regression testing, reused here as a fast, visual way to recognize sites across a large fleet at a glance rather than parsing text.
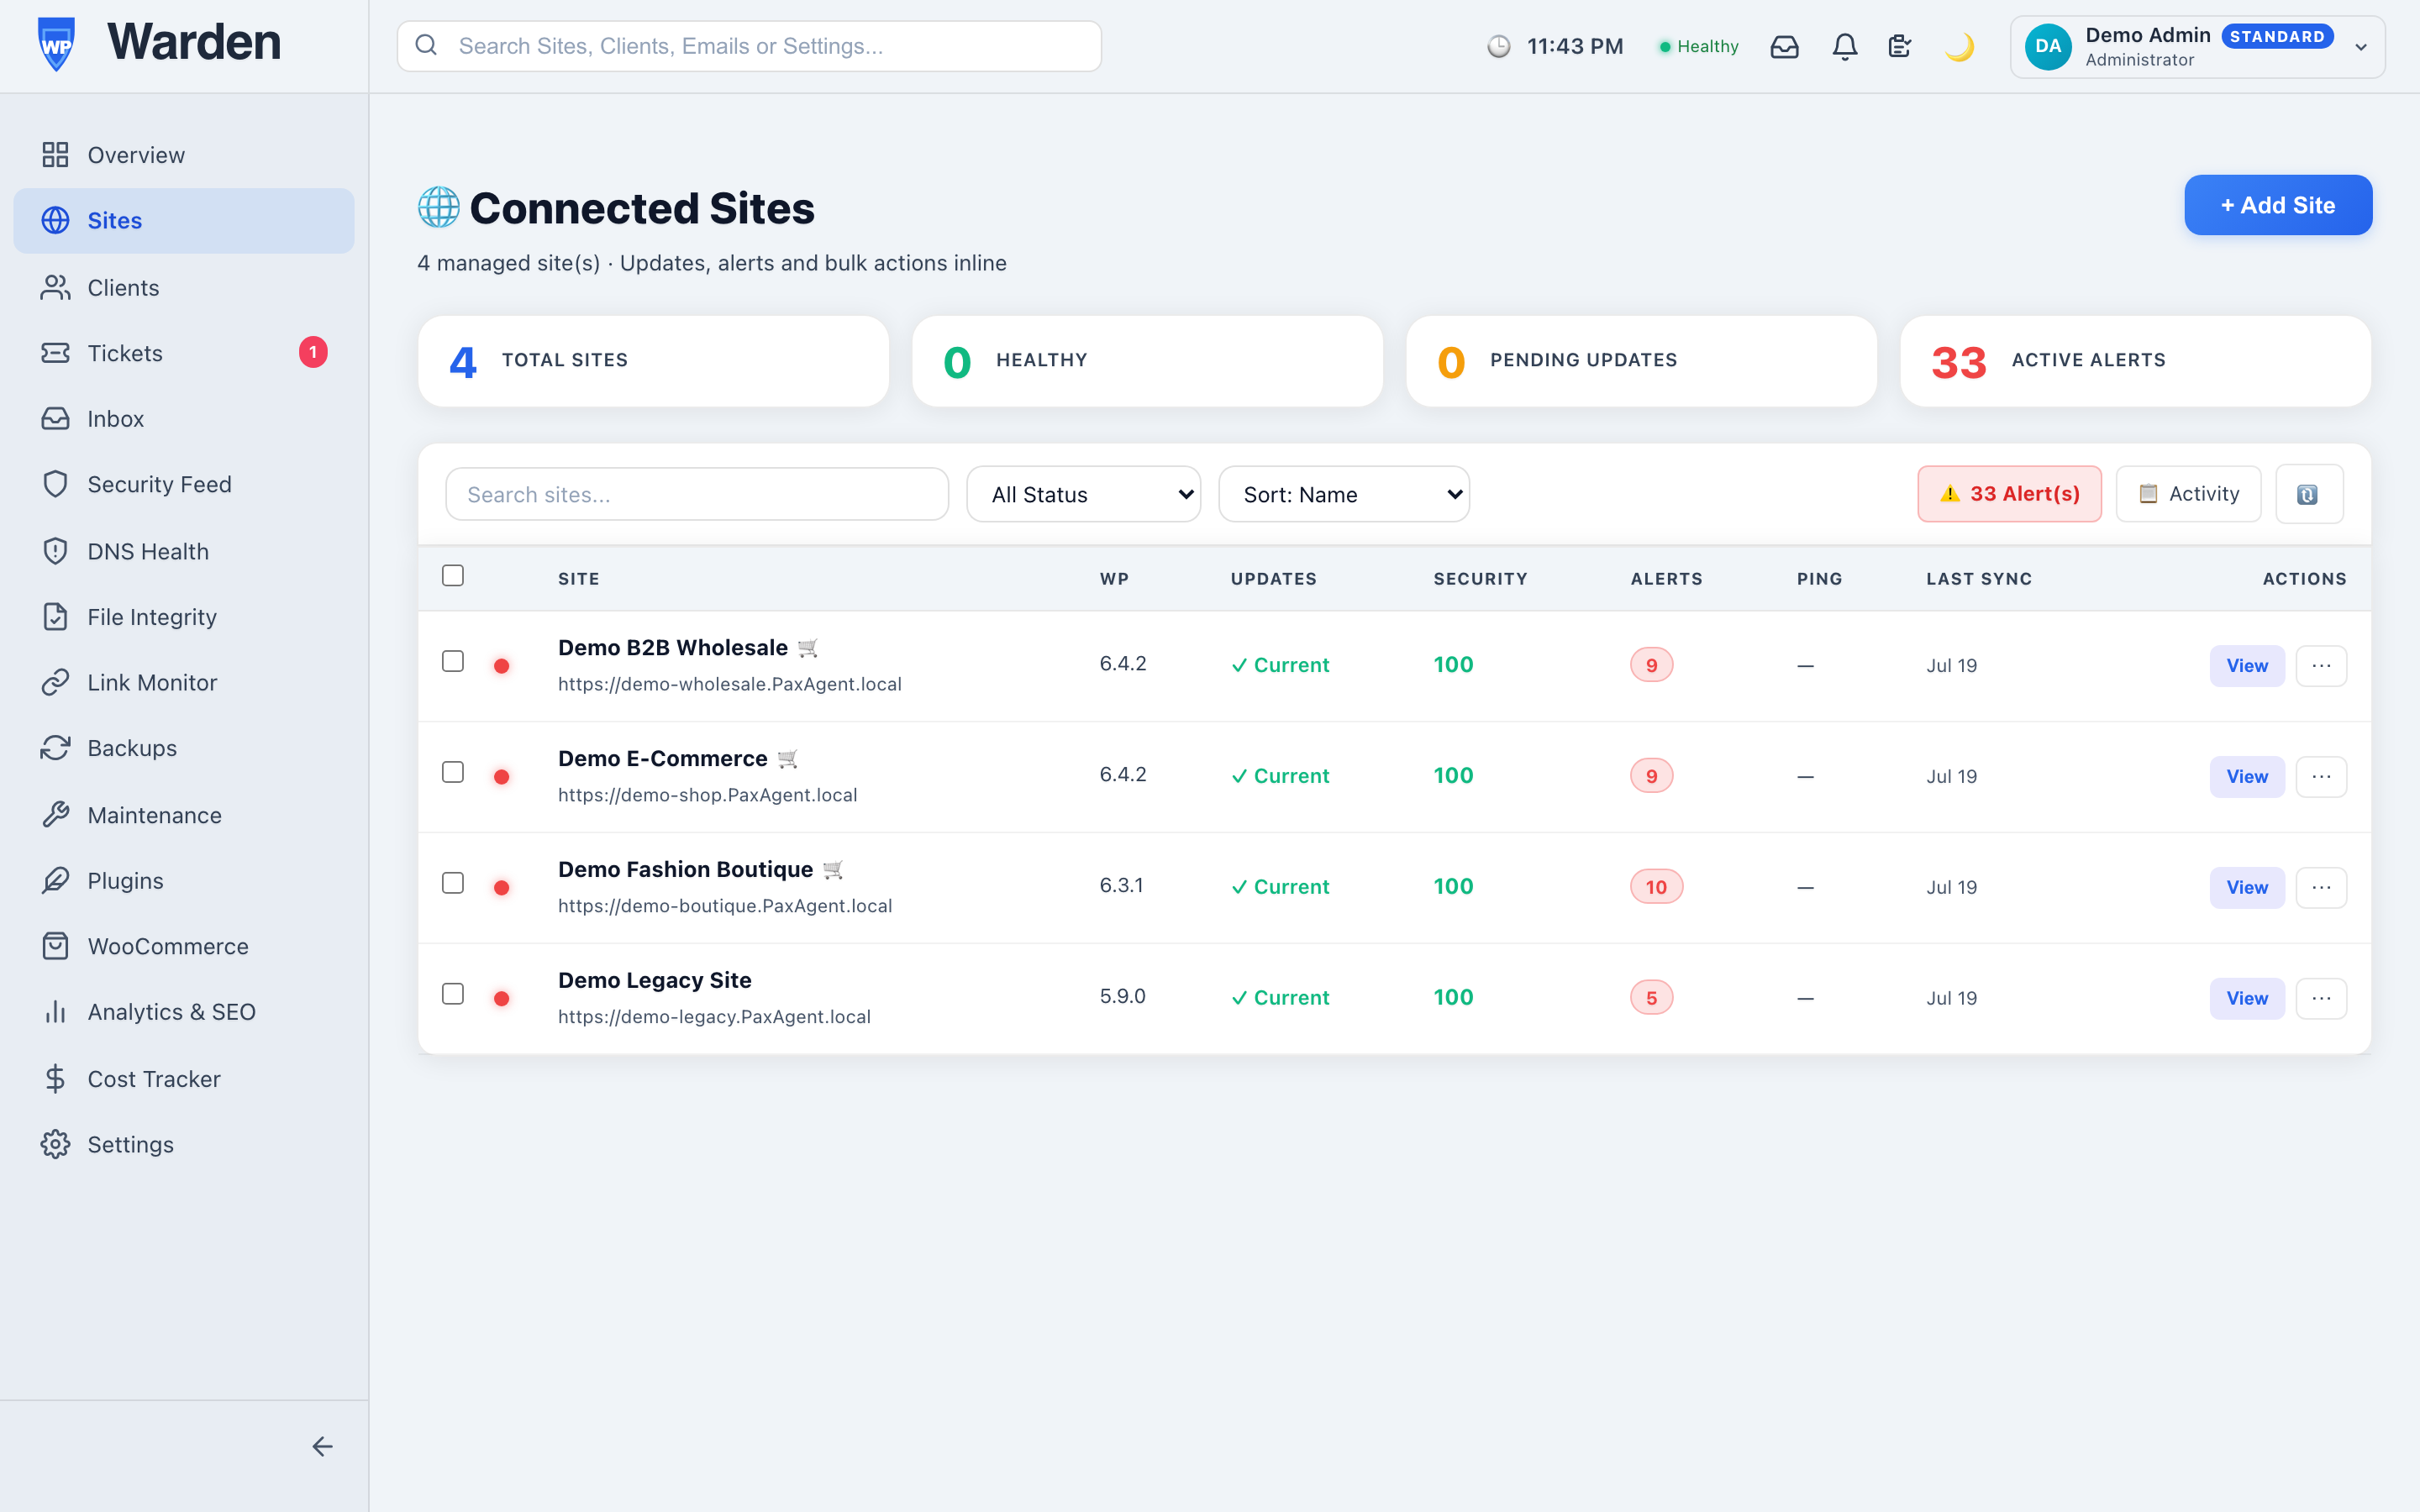
There’s a genuine secondary benefit here that wasn’t the original point: a site with a badly broken layout — a missing stylesheet, a completely blank hero section — stands out immediately when you’re scanning real thumbnails, often before any formal monitoring alert has even had a chance to fire. It’s not a substitute for actual monitoring, but as a quick visual gut-check while doing something else entirely, it catches things surprisingly often.
A screenshot is only useful for quick recognition if it’s reasonably current — a homepage image from eight months ago, after a full redesign, defeats the purpose entirely. Since this reuses the same capture engine already running for visual regression testing, the image reflects a genuinely recent state of the site rather than a one-time capture frozen at whatever point it was first added to the fleet.
It’s worth being clear that this is a recognition aid, not a monitoring system in its own right — a site can look perfectly normal in a screenshot while having a real problem a human eye simply can’t see in a static image. The value here is purely in speeding up the everyday task of telling sites apart, freeing up actual monitoring tools to do the deeper, more rigorous work of confirming whether something is actually wrong.
Real screenshots of each site’s actual homepage, captured automatically rather than any kind of generic stand-in image.
No — it reuses the exact same capture engine already running for that feature, with no additional system to maintain.
Start a free 14-day trial — no credit card required.
A client emails to say their site has “felt off” recently, and asks when the problem actually started. It’s a completely reasonable question and, without a real historical record, an unanswerable one — you can describe how the site looks today, but not credibly say whether today looks different from three weeks ago, because nothing was ever written down.
Without a documented history, every investigation into “when did this begin” turns into reconstructing events from memory — checking recent update logs, trying to recall if anything unusual happened around a certain date, hoping someone wrote something down in passing. It’s slow, it’s unreliable, and it puts you in the position of guessing in front of a client who’s asking a very specific question.
Every day, WP Warden’s health snapshot engine writes a new row capturing a site’s full condition at that moment — not just a single score, but the actual health components that produced it. This builds a permanent historical record you can consult later for a genuinely specific question: what did this site’s condition actually look like three weeks ago Tuesday.
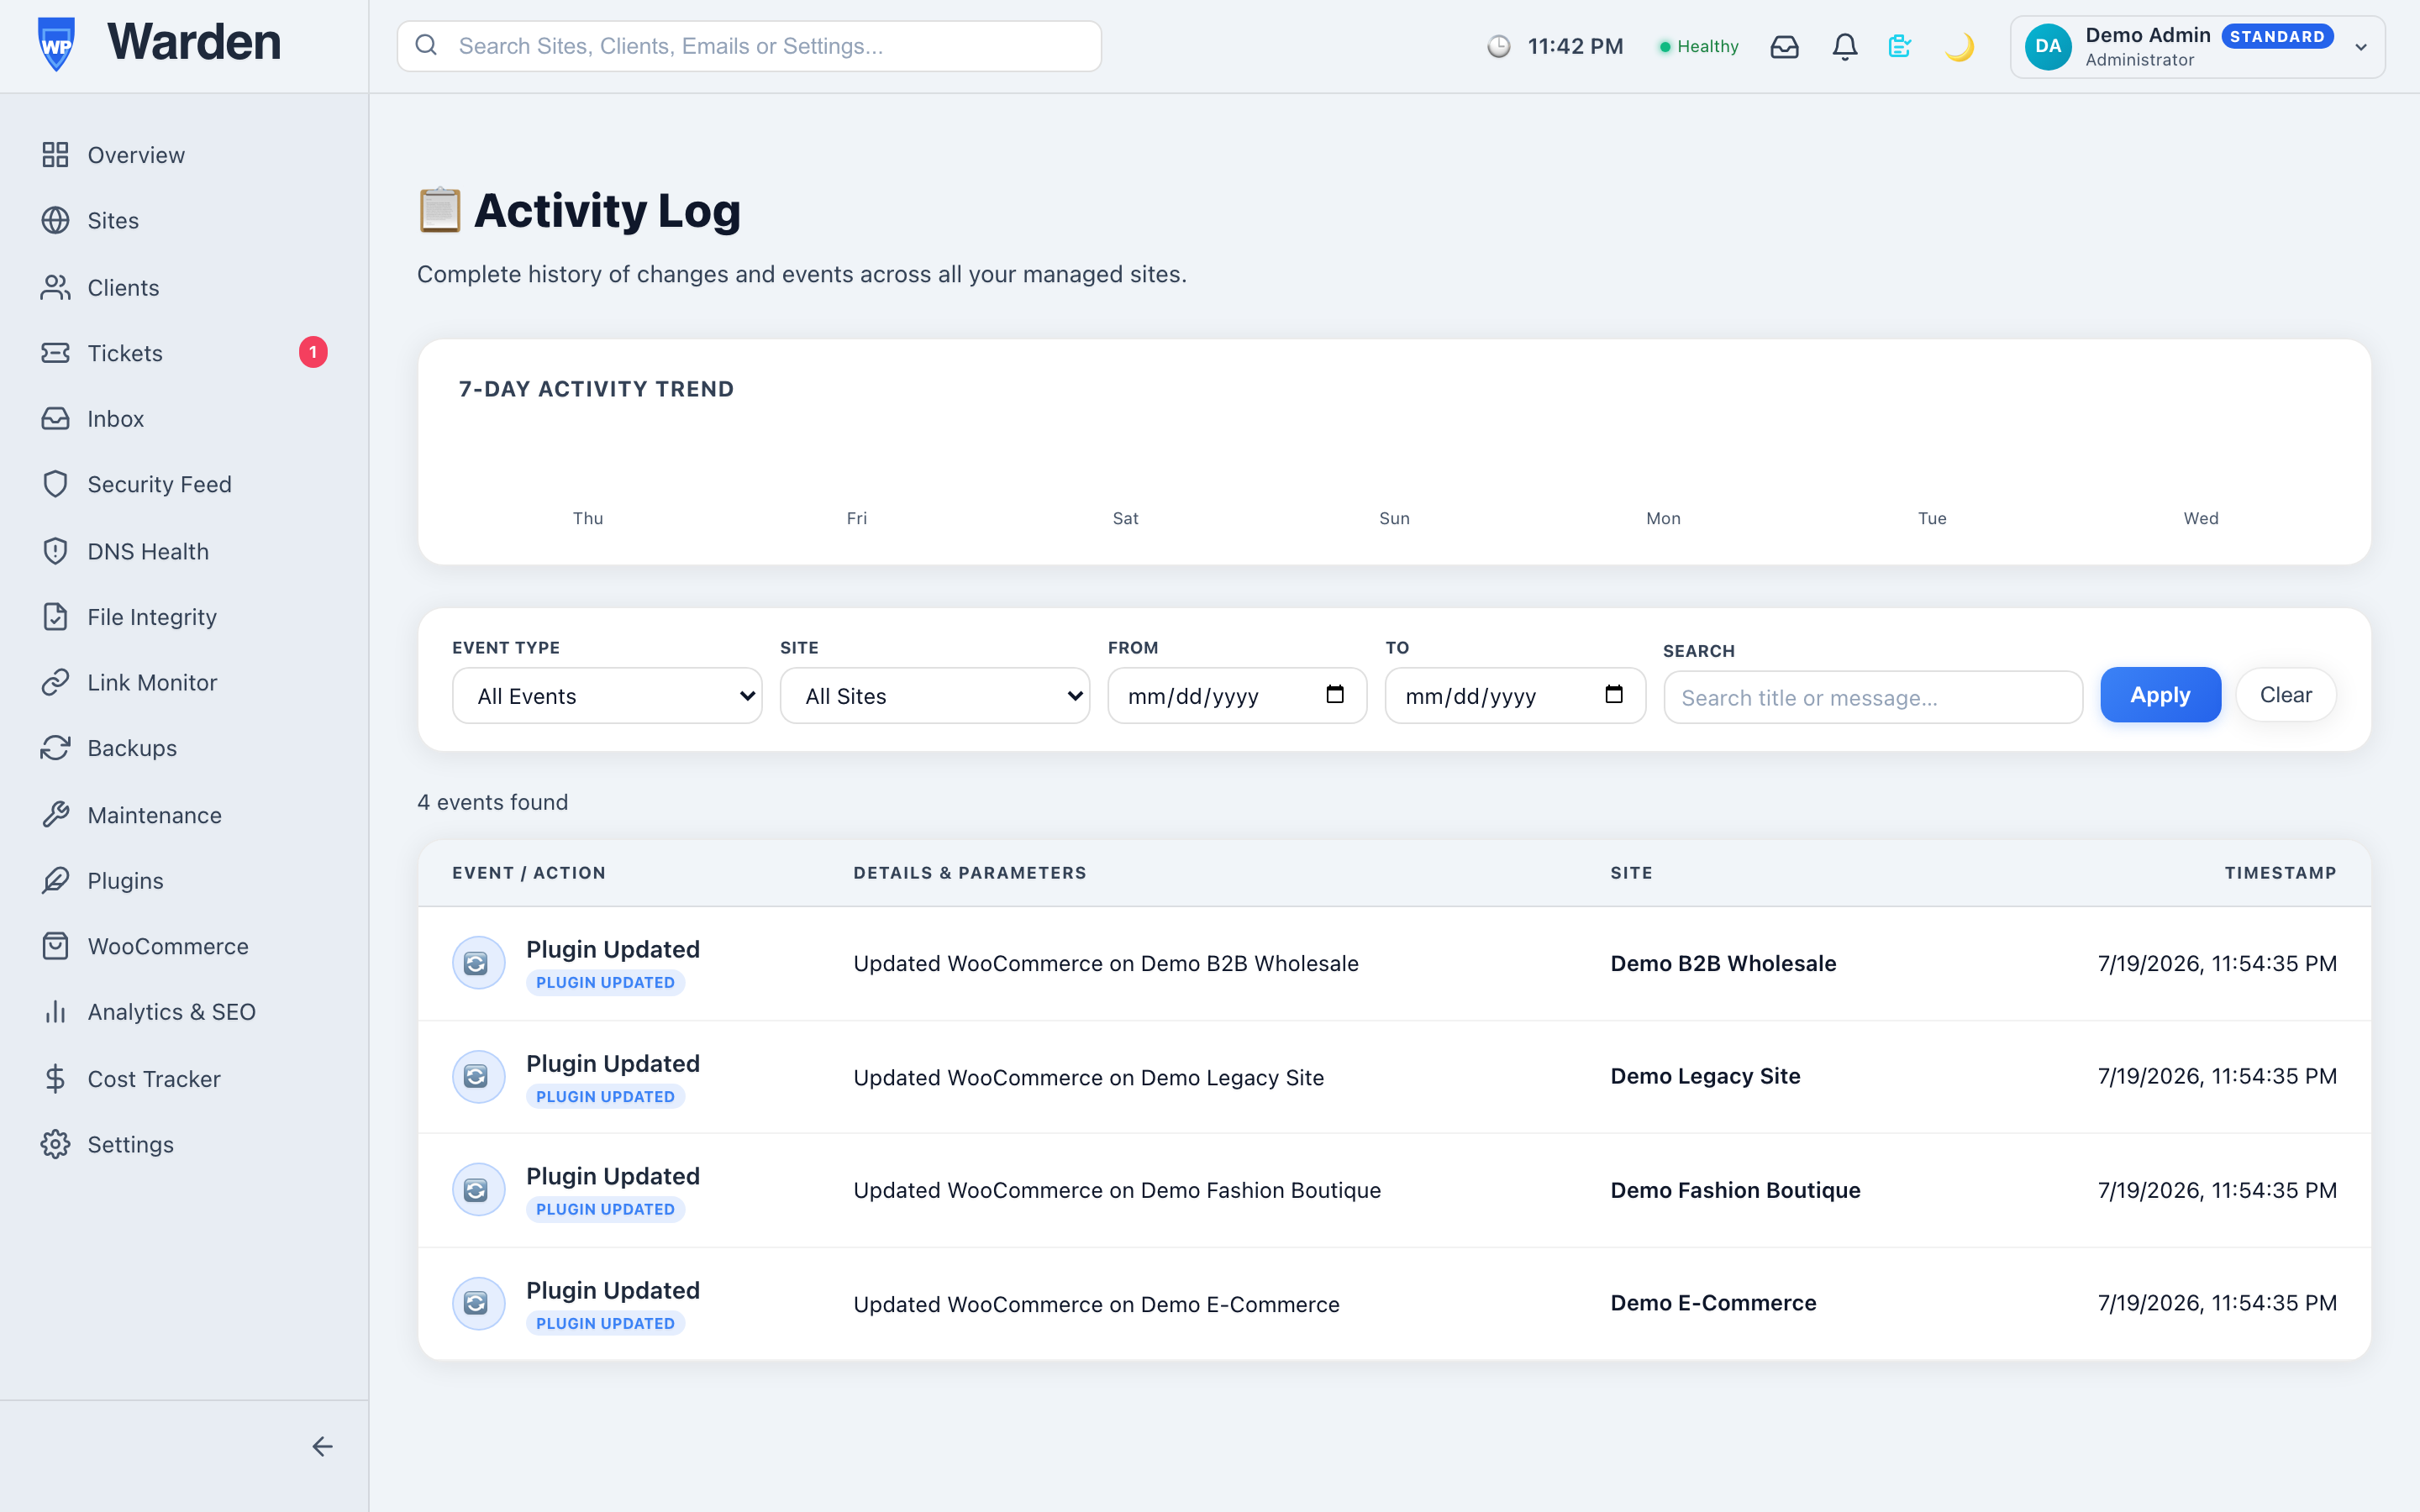
It’s tempting to think of this data as existing purely to power the visual sparkline trend, but the underlying record goes considerably deeper and further back than what any chart displays by default. That depth is what makes it genuinely useful for investigation, not just at-a-glance visualization — comparing a site’s real condition before and after a major hosting migration weeks apart, for instance, is a question the raw record answers even though no chart was ever built to show that specific comparison.
A client insists a problem has “always been there,” while you’re fairly confident it started recently. Rather than a conversation built on competing impressions, the snapshot history settles it directly: pull up the exact date the metric in question actually changed, and the disagreement resolves itself with data rather than two people trying to out-remember each other. That’s a genuinely different, calmer kind of conversation than one built entirely on recollection.
Unlike the default sparkline, which is intentionally limited to a recent window for readability, the underlying record itself keeps accumulating for as long as a site has been monitored. That means a question about a site’s condition from months ago is still answerable, not just something covered for the most recent few weeks — a meaningfully different guarantee than a tool that only ever shows you the recent past.
No — the underlying record accumulates well beyond the default sparkline display, available for deeper investigation whenever it’s needed.
Full detail — the actual health components behind each day’s score, not just one summarized number.
Start a free 14-day trial — no credit card required.
A client messages asking for a specific plugin to be installed — nothing complicated, just a form builder or a caching plugin they’ve heard good things about. The old routine: open a new tab, navigate to their site’s wp-admin, log in, find the plugin, install it, close the tab. Five minutes for one small favor, repeated every time a similar request comes in.
Search the full WordPress.org plugin directory directly from the WP Warden dashboard and install anything you find to a remote site in one click, with no need to log into WordPress for that site first. The command travels through the same reliable command channel that powers every other remote action, and the site reports installation success or failure back to the dashboard automatically.
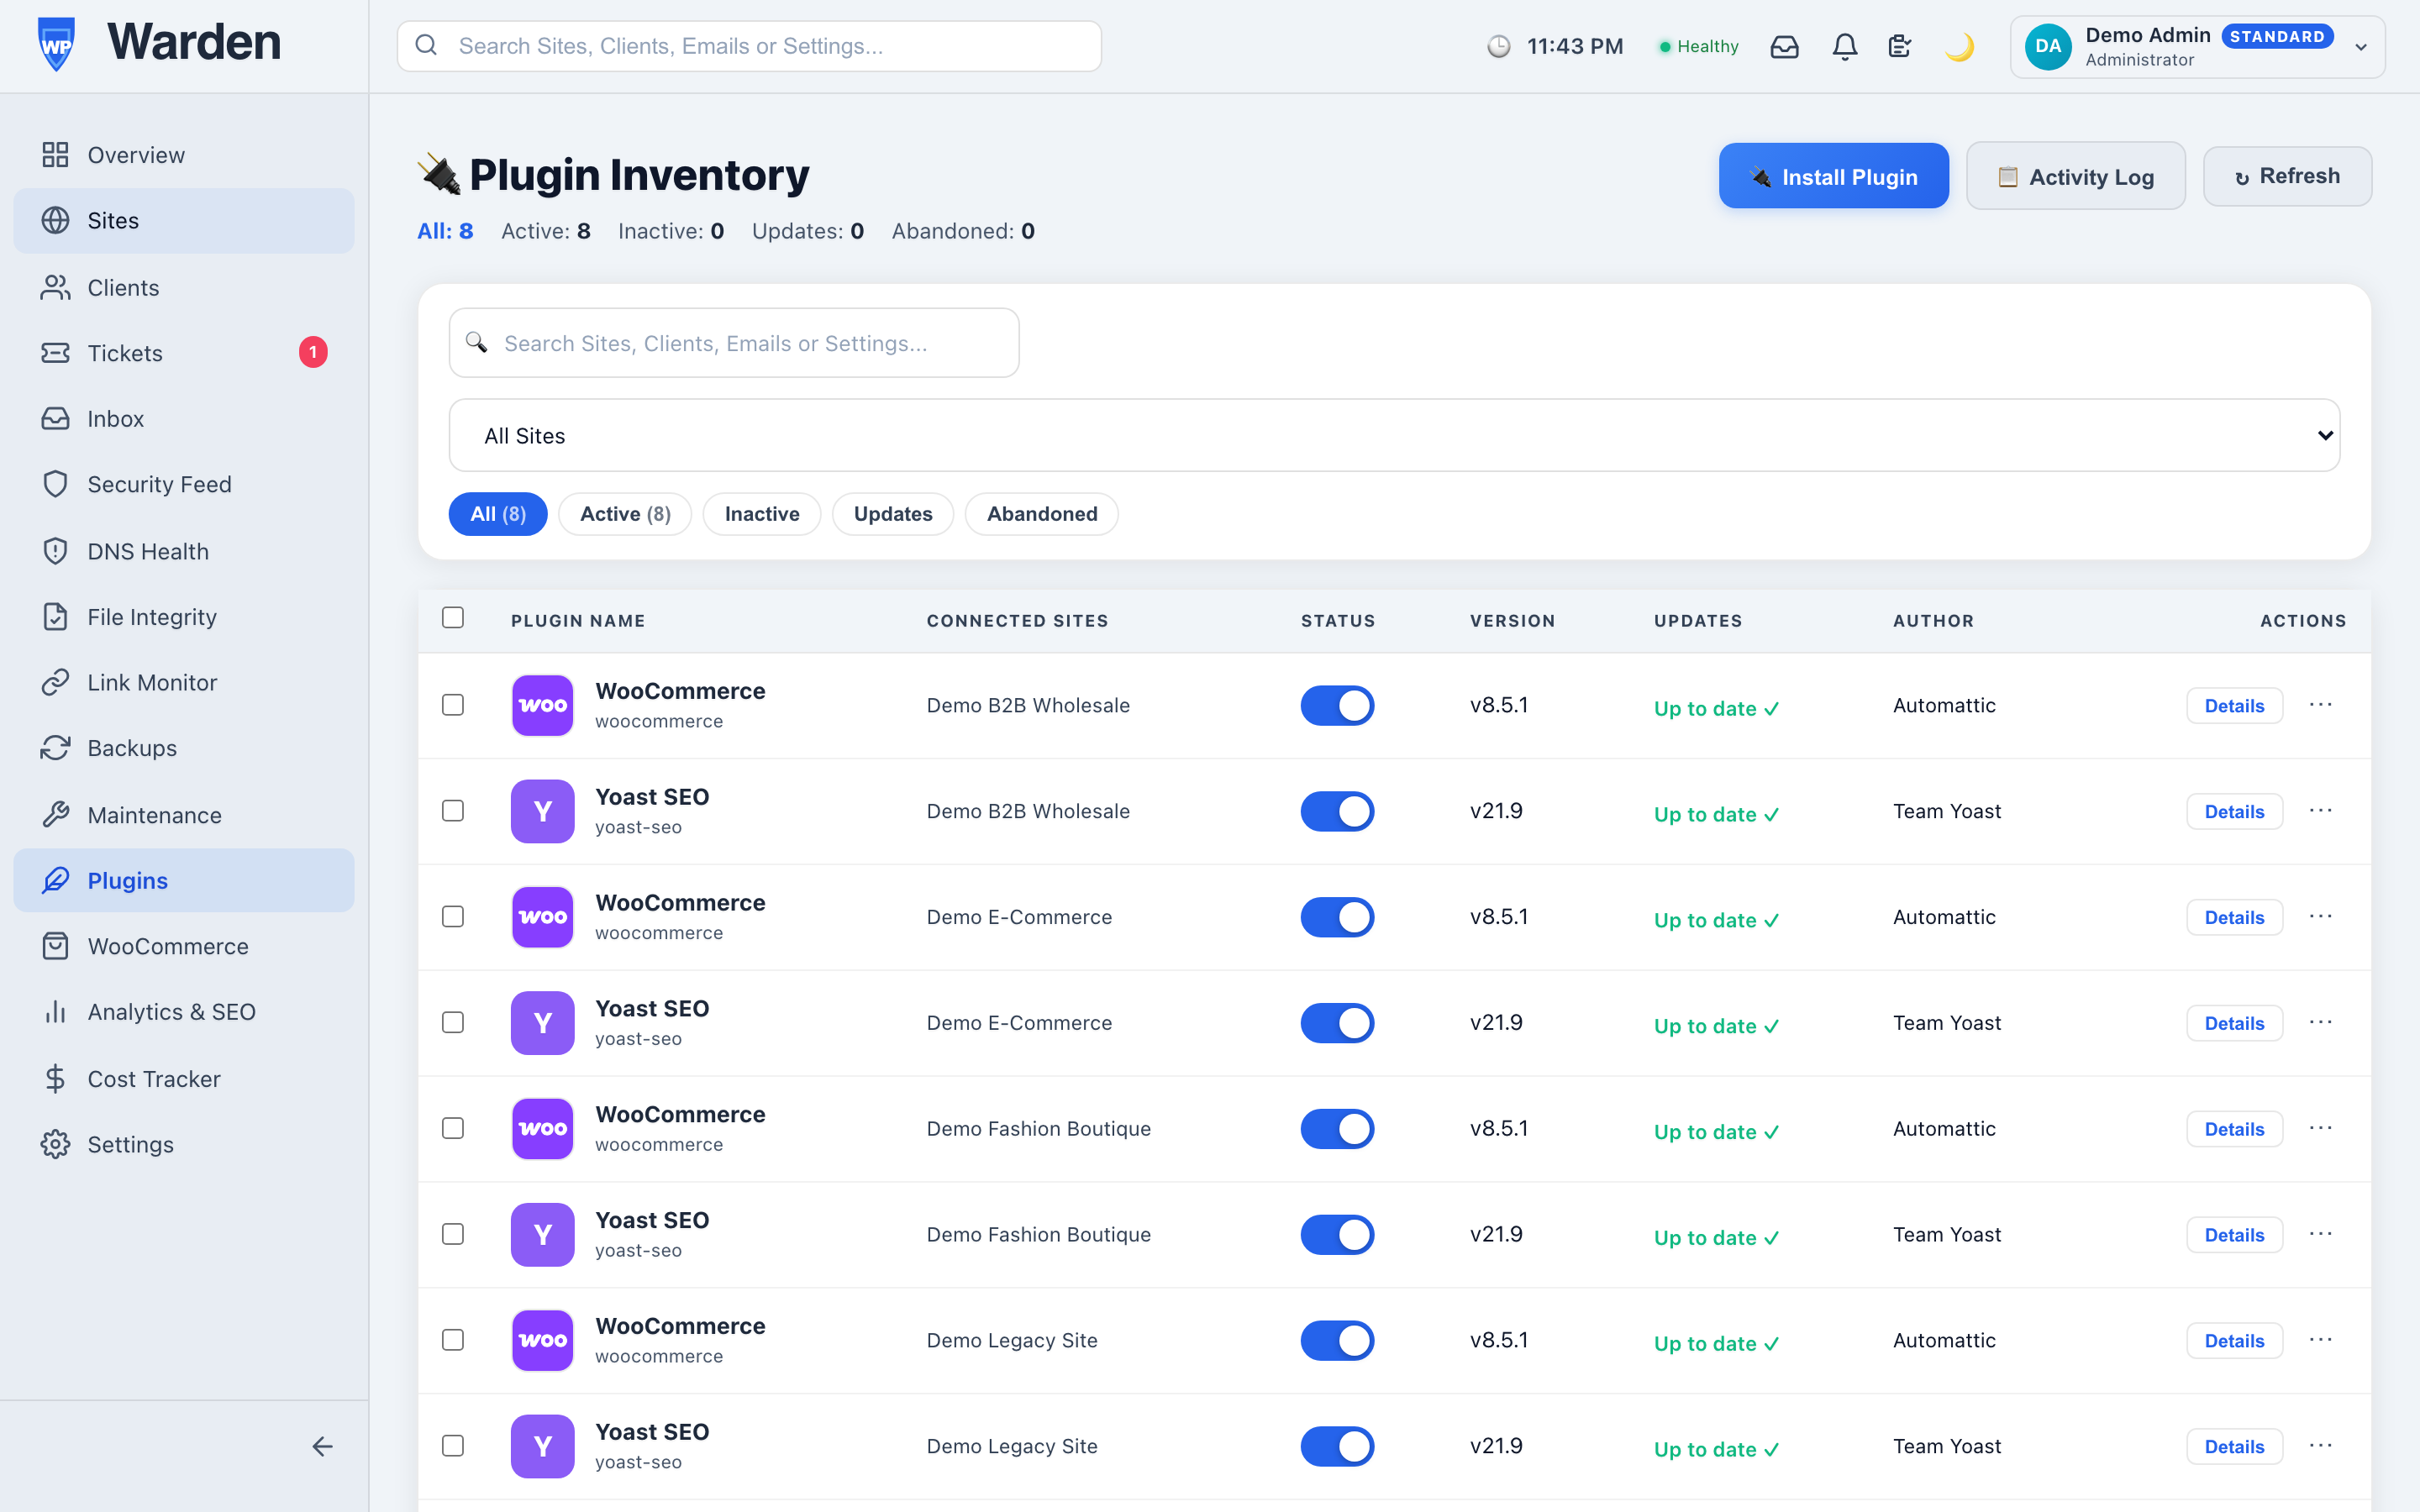
A pre-curated shortlist of “approved” plugins sounds convenient until the specific plugin a client wants isn’t on it. Searching the same complete WordPress.org directory that wp-admin itself uses means there’s never a gap between what a client can reasonably ask for and what’s actually installable from the dashboard — the full ecosystem is available, not a subset someone decided was popular enough to include.
The five-minute favor becomes genuinely significant when the same plugin needs to go onto fifteen client sites at once — a common scenario when standardizing a fleet on a new security plugin, for instance. Installing it remotely, site by site, from the same dashboard without a single separate login, turns what would have been over an hour of repetitive logins into a task measured in minutes. Newly installed plugins show up immediately in the same fleet-wide plugin management view alongside everything else already installed.
Not every remote installation succeeds on the first try — a site might be temporarily unreachable, or a plugin might have a compatibility issue with the site’s current WordPress version. When that happens, the failure is reported back to the dashboard clearly rather than leaving you uncertain whether it actually worked, so there’s never a need to separately log into the site just to confirm one way or the other. That reporting loop is what makes remote installation trustworthy enough to rely on for real client requests, not just a convenience for the cases that happen to go smoothly.
A real remote installation over the command channel — not simply opening a WordPress login link for you to complete manually.
Yes, one at a time through the same fast workflow, without needing separate logins for each individual site.
Start a free 14-day trial — no credit card required.
A single brute-force attempt sweeps across twenty client sites in the space of an hour. Without correlation, that’s twenty separate alerts landing in an inbox within minutes of each other — and the very real risk is that the twenty-first email, the genuinely different one about an actual malware finding, gets skimmed past along with the rest, because by then the inbox has already trained you to stop reading closely.
Alert fatigue isn’t a sudden event — it’s a gradual erosion of trust in the alerting system itself. The first few duplicate alerts for the same incident are annoying. By the fiftieth, most people have started skimming subject lines instead of reading content, which means the one alert that actually needed a careful read gets the same half-second of attention as everything else. The system technically still works; the human on the other end of it has stopped being able to use it properly.
WP Warden’s alert notification intelligence layer groups related events and applies contextual rules before delivery. The same IP address hitting multiple sites in a short window is sent as one correlated alert instead of dozens of separate messages, and repetitive notices like “update available” are batched into a single daily digest window rather than trickling in alert-by-alert throughout the day.
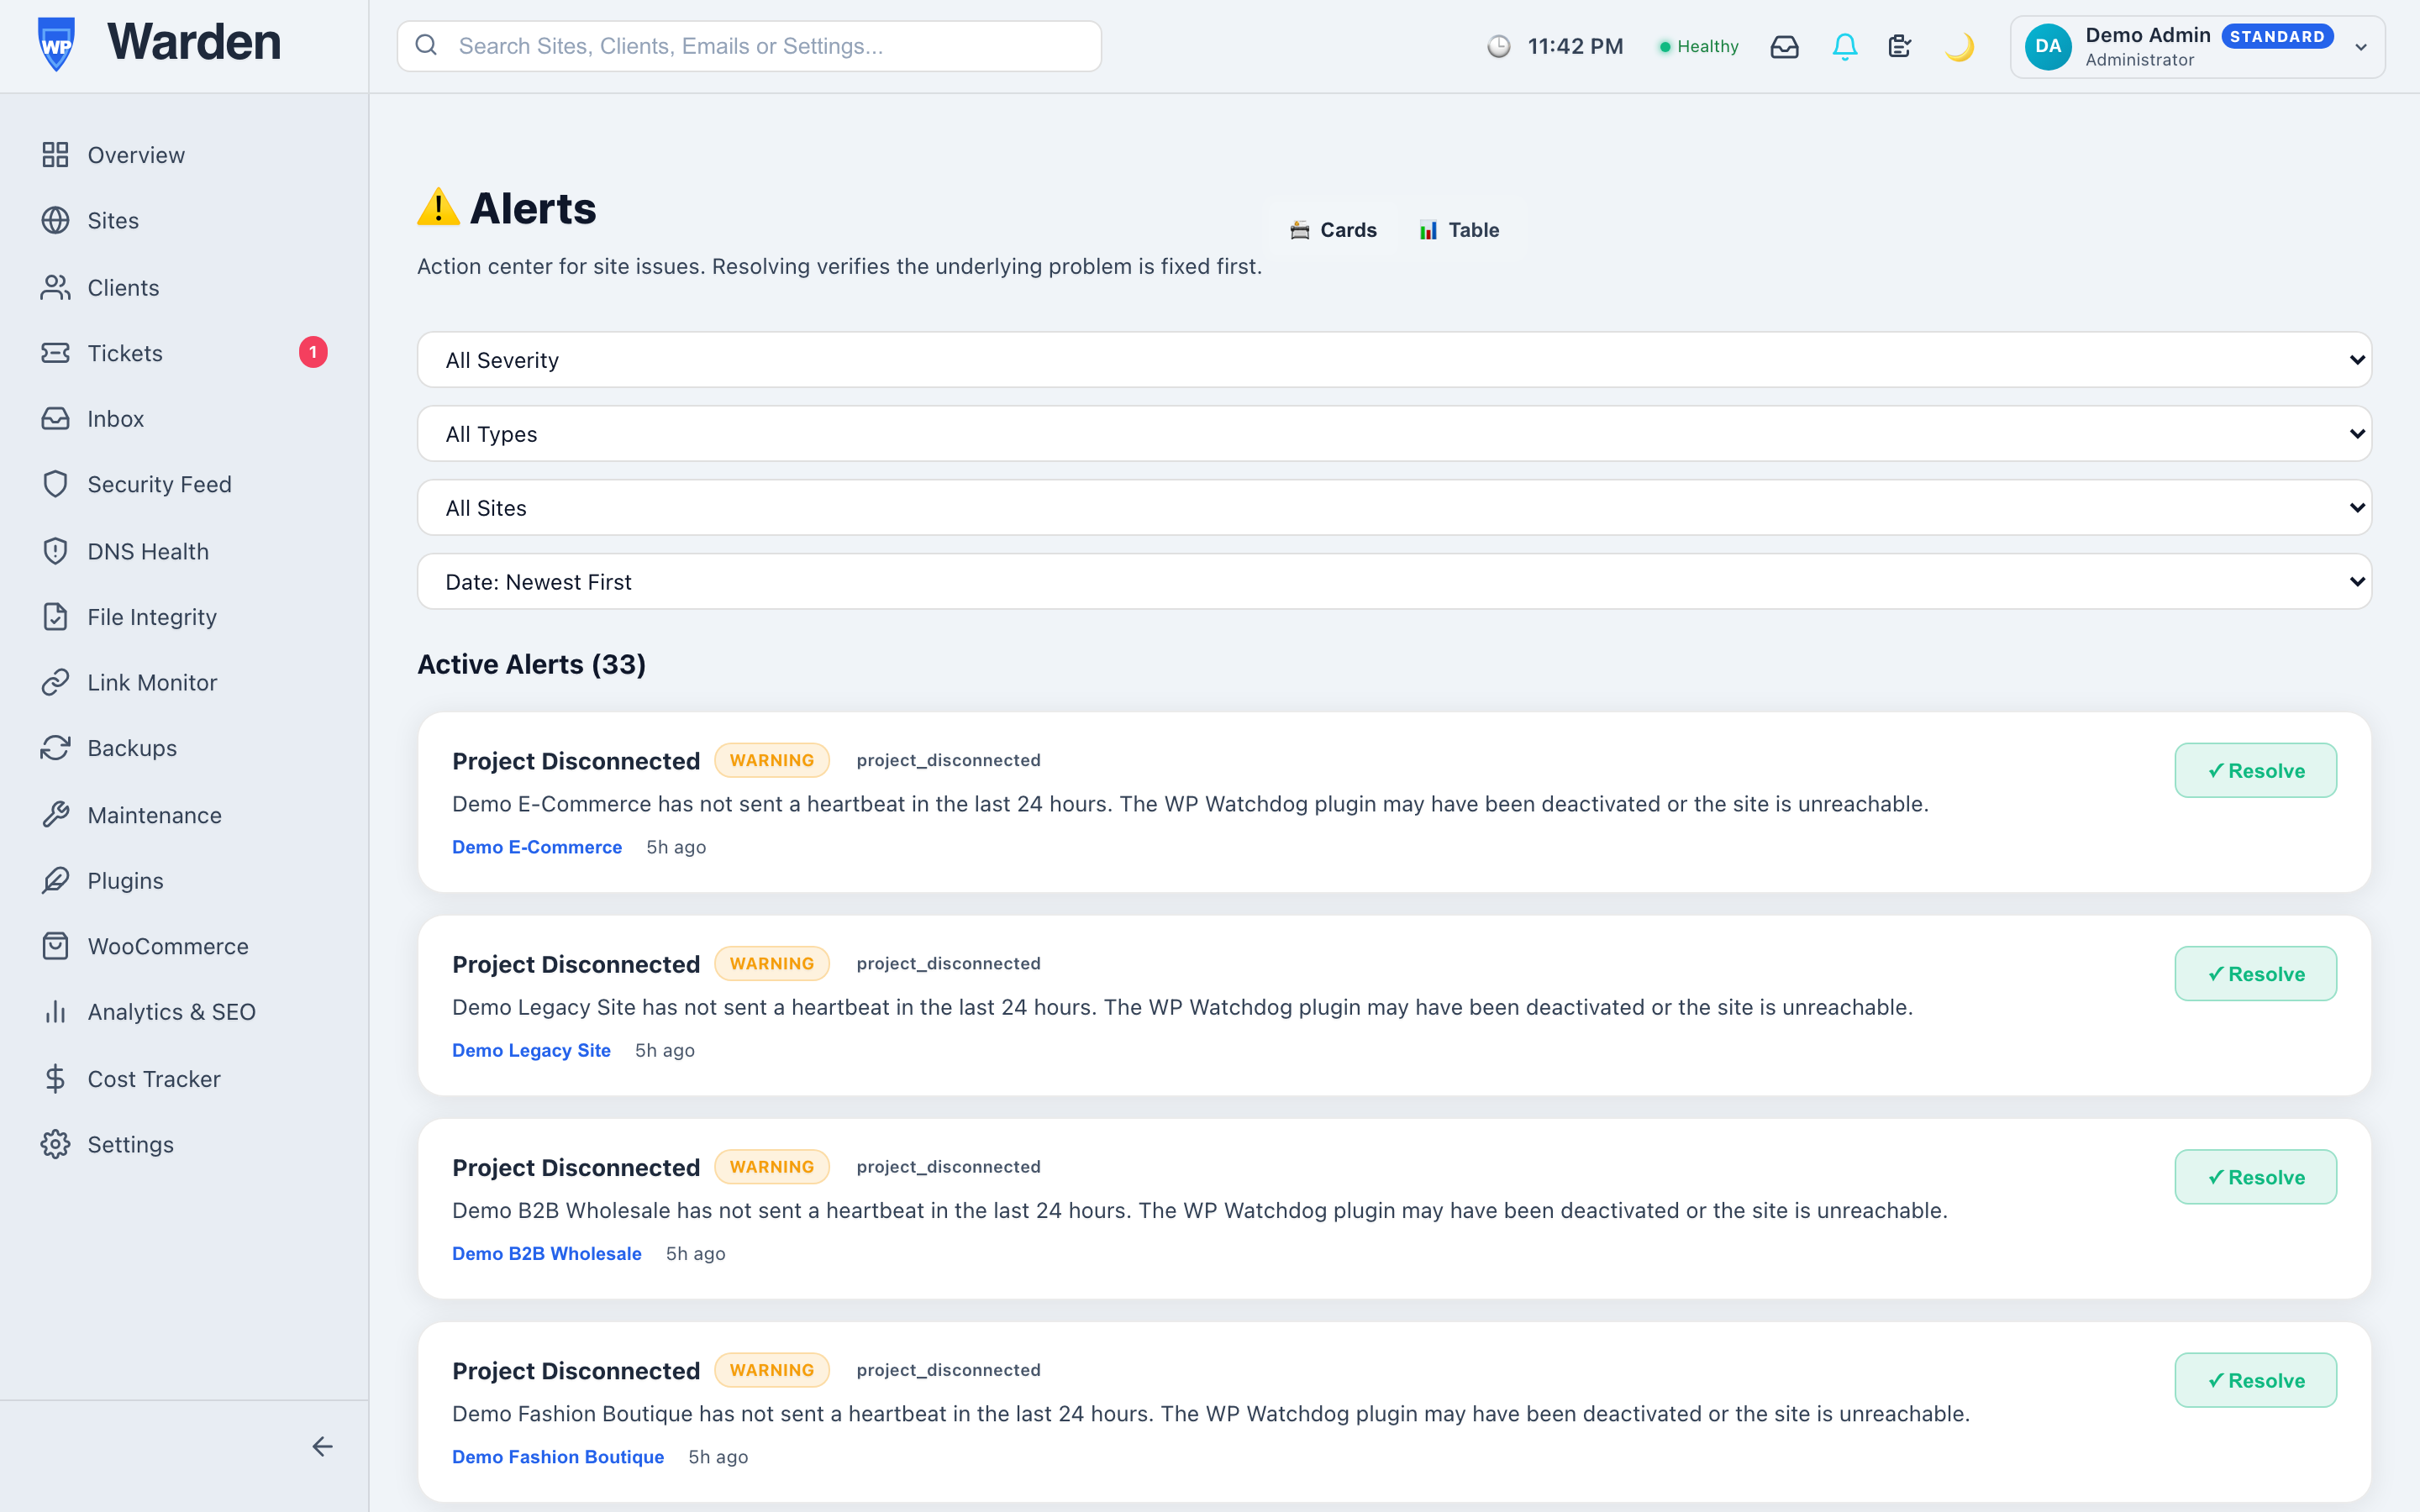
The obvious worry with batching anything security-related is that it trades speed for clarity. It doesn’t have to — correlated and batched alerts still arrive over the same live WebSocket connection as everything else, the moment they’re generated. What changes is the shape of what arrives, not when it arrives: one clear, connected alert about a fleet-wide pattern, delivered instantly, instead of twenty identical ones delivered at the same instant.
Without correlation, a coordinated scan across fifteen client sites in one afternoon produces fifteen nearly identical emails, each requiring its own click to open and dismiss, with no indication any of them are related to each other. With correlation, the same event produces one alert stating plainly that a single source is probing fifteen sites, with all fifteen listed together. The underlying security event is identical either way — what changes entirely is whether a human reading the alert immediately understands the real scope of what’s happening, or has to reconstruct it manually from fifteen separate messages.
The real cost of alert fatigue isn’t the annoyance of a full inbox — it’s the one time a genuinely important alert gets skimmed past along with everything else, precisely because the inbox has trained you to skim. That single missed alert can be the difference between catching a real compromise within minutes and discovering it days later from a client. Correlation exists specifically to prevent that inbox from ever reaching the point where skimming feels necessary in the first place.
No — batching applies only to repetitive, non-urgent notices like update availability. Genuinely time-sensitive alerts still arrive instantly.
Real contextual rules — like the same source IP within a short time window — not simple keyword matching on the alert text itself.
Start a free 14-day trial — no credit card required.
A health score of 82 out of 100 sounds fine, sitting there in isolation. What it doesn’t tell you is whether that’s an improvement from last week’s 76, or a decline from a 94 you’d have noticed immediately if you’d been watching. A single number without a trend line behind it is a snapshot pretending to be a story.
Point-in-time health scores are useful for exactly one question: how is this site doing right now. They’re the wrong tool for a much more important question — is this site’s condition better, worse, or unchanged compared to where it was. Answering that second question honestly requires actual history, not a single reading no matter how often you refresh it.
Every day, WP Warden’s health snapshot engine records the key health data points for every site at that exact moment. That daily record builds a thirty-day sparkline trend visible directly in the site list and on each site’s own detail page — a real history built from actual daily snapshots, not an estimate smoothed over or extrapolated backward from a couple of data points.
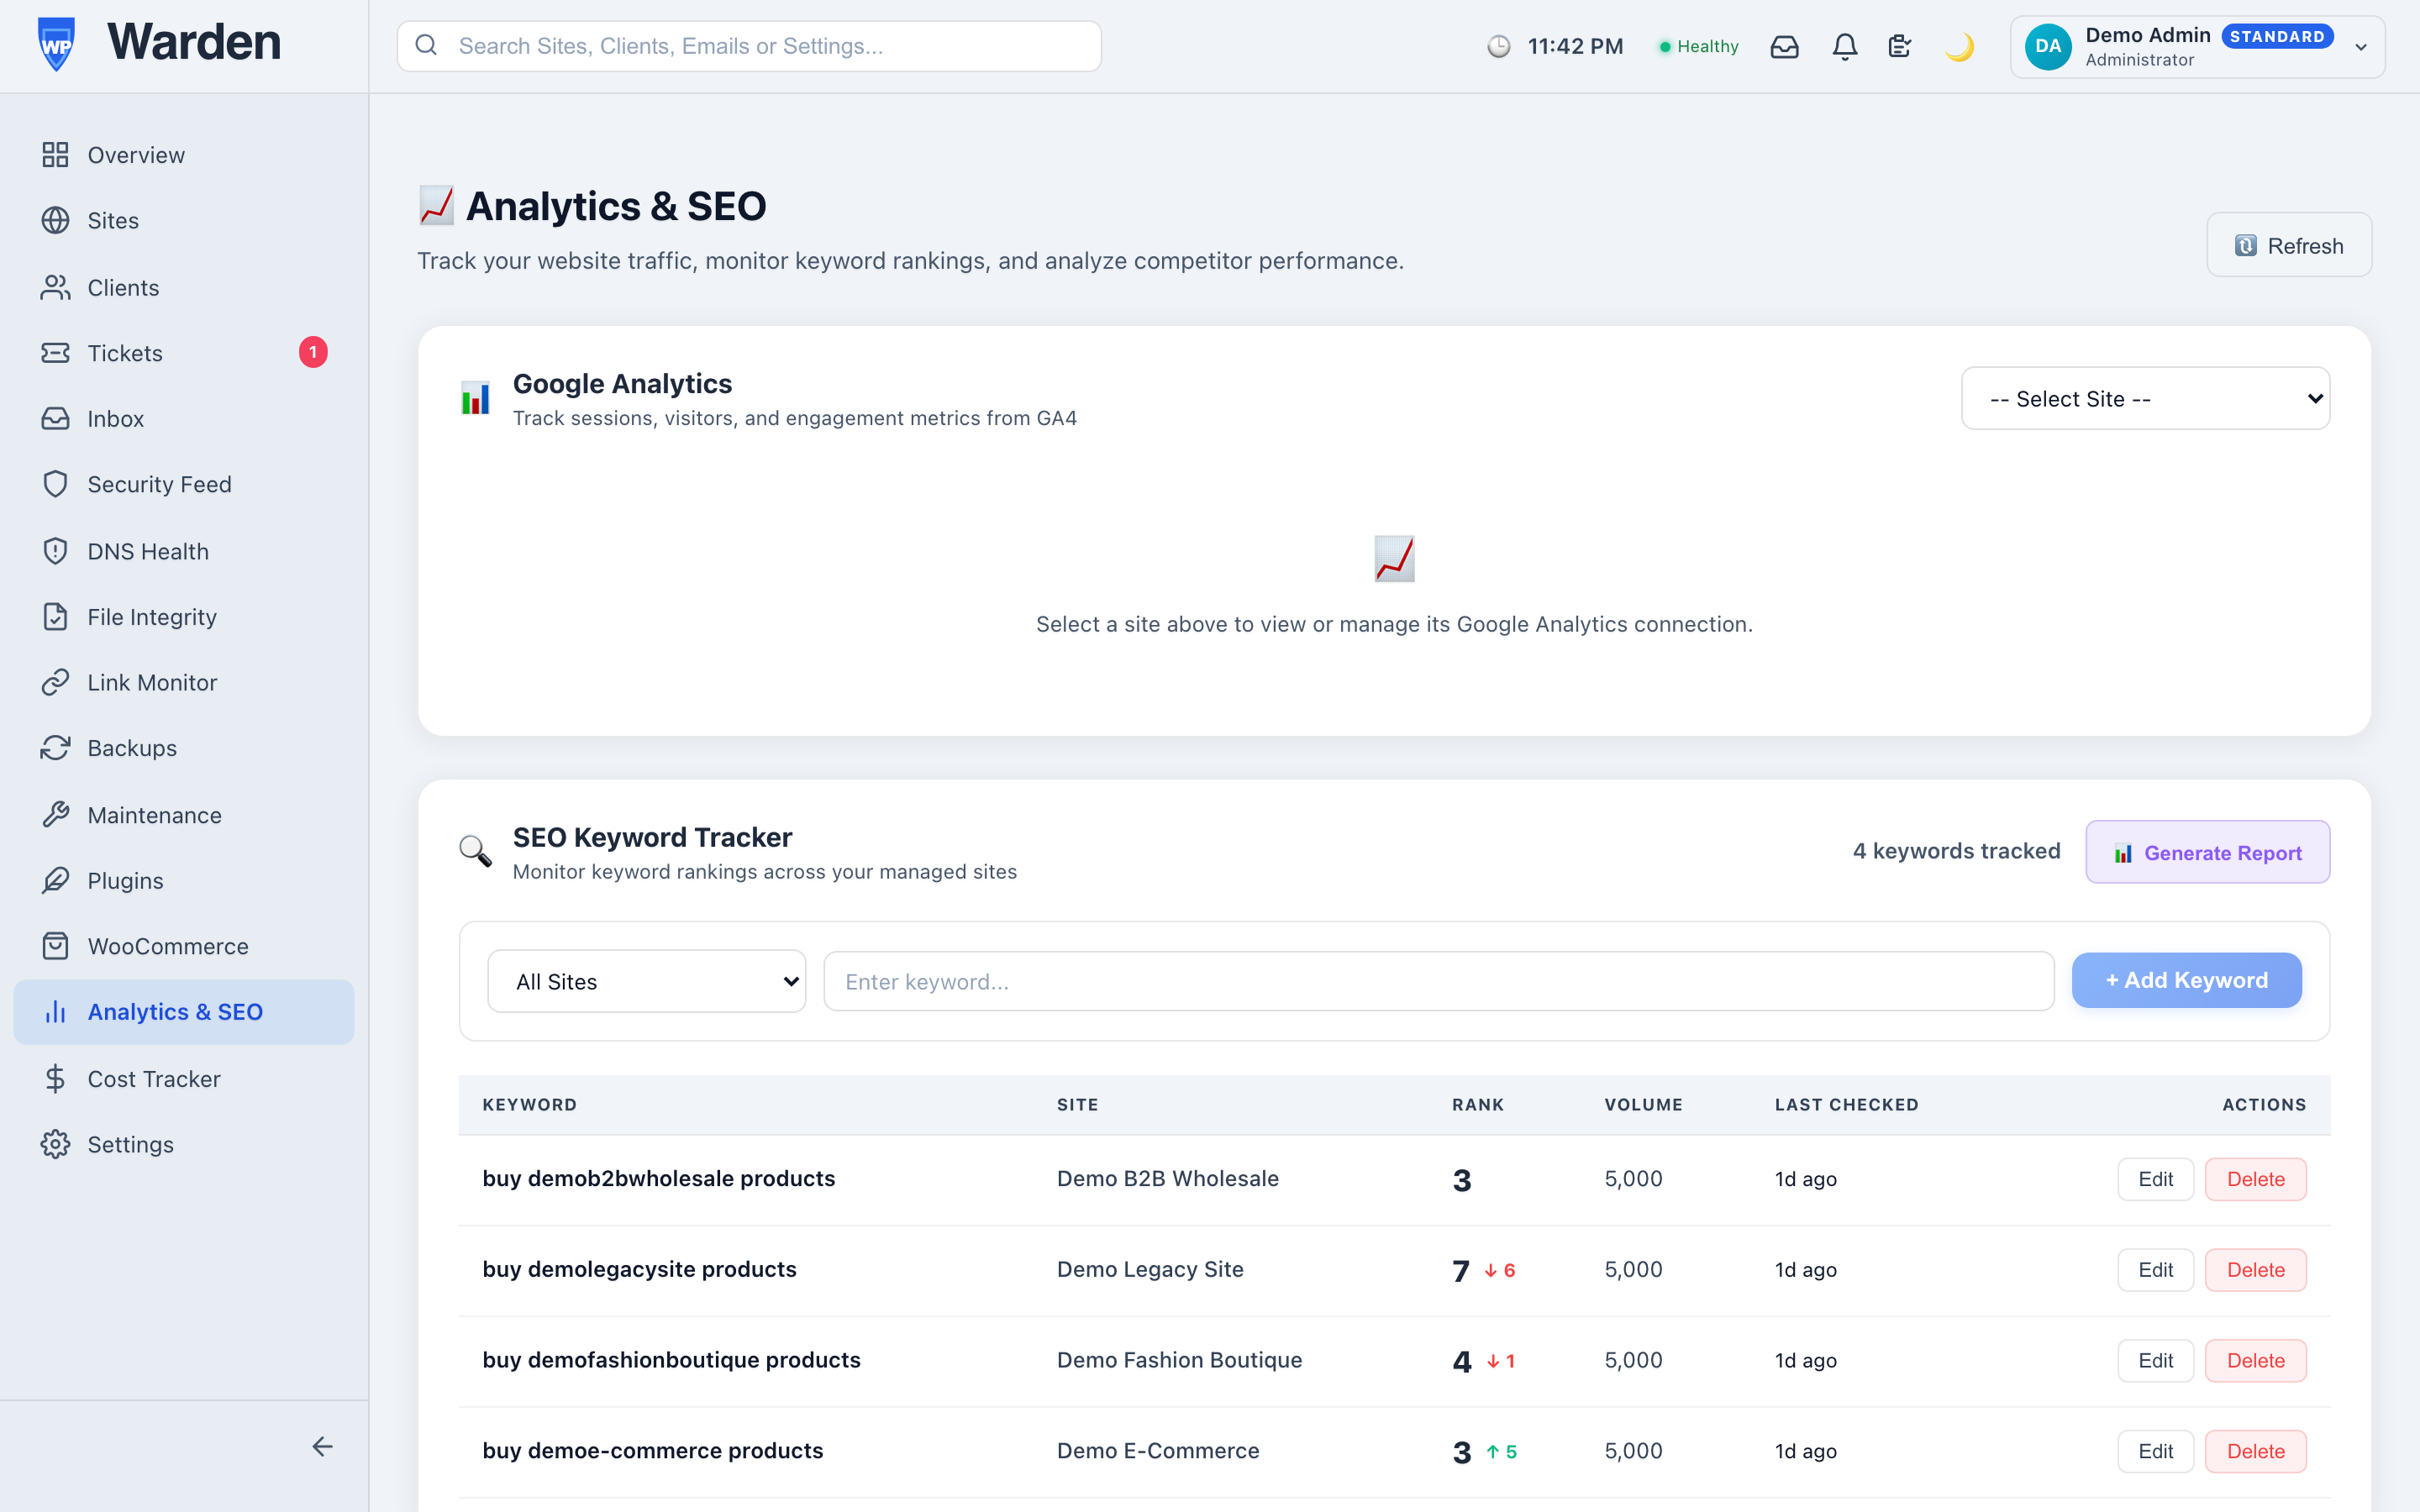
The most dangerous kind of health problem isn’t a sudden crash — it’s a slow, steady decline spread across weeks, where no single day is ever bad enough to trigger an alert on its own. A creeping resource issue, a plugin update that introduced a small but real performance regression, an accumulating backlog of minor errors. None of these look urgent glanced at individually. All of them look obvious the moment you see the trend line pointing the wrong direction for three weeks straight. Scanning trend sparklines across a whole fleet at once turns this from something you’d have to notice by accident into something the dashboard surfaces for you.
The sparkline is a compact view over a much deeper record — the full health snapshot history — available whenever you need to dig into exactly what a site’s condition was on a specific past date.
Not every dip in a health trend deserves the same reaction. A single-day drop that recovers immediately is usually noise — a brief resource spike, a one-off slow response. What’s worth actually investigating is a trend that keeps moving in the same direction across multiple consecutive readings, since that’s the pattern that indicates something is genuinely changing about the site’s underlying condition rather than a one-time blip. Learning to tell the two apart at a glance is most of what makes the sparkline actually useful day to day, rather than just visually interesting.
Real data — a genuine daily snapshot recorded for every site, not an estimate or an interpolation between a couple of points.
Yes — the underlying snapshot history accumulates well beyond what the default sparkline displays, available for deeper investigation whenever needed.
Start a free 14-day trial — no credit card required.
A client’s store goes down for twenty minutes on a Tuesday afternoon. Your monitoring catches it, resolves it, and the incident report reads clean: brief outage, quickly fixed. What that report doesn’t say is how many actual orders were lost during those twenty minutes — because the tool that tracks uptime and the tool that tracks revenue have never once talked to each other.
Technical health and business performance for the same WooCommerce store usually live in two entirely disconnected places — your monitoring dashboard, and the store’s own WooCommerce admin. The two only ever get compared if someone happens to think to check both at the same time, which in practice means the connection between a technical incident and its real business cost almost never gets made at all, unless a client happens to bring it up first.
Connect a store’s WooCommerce REST API credentials, and WP Warden’s WooCommerce integration shows revenue, order count, and top-selling products directly alongside that site’s health and uptime monitoring — real store data pulled straight from the store’s own API, not an estimate inferred from general site traffic.
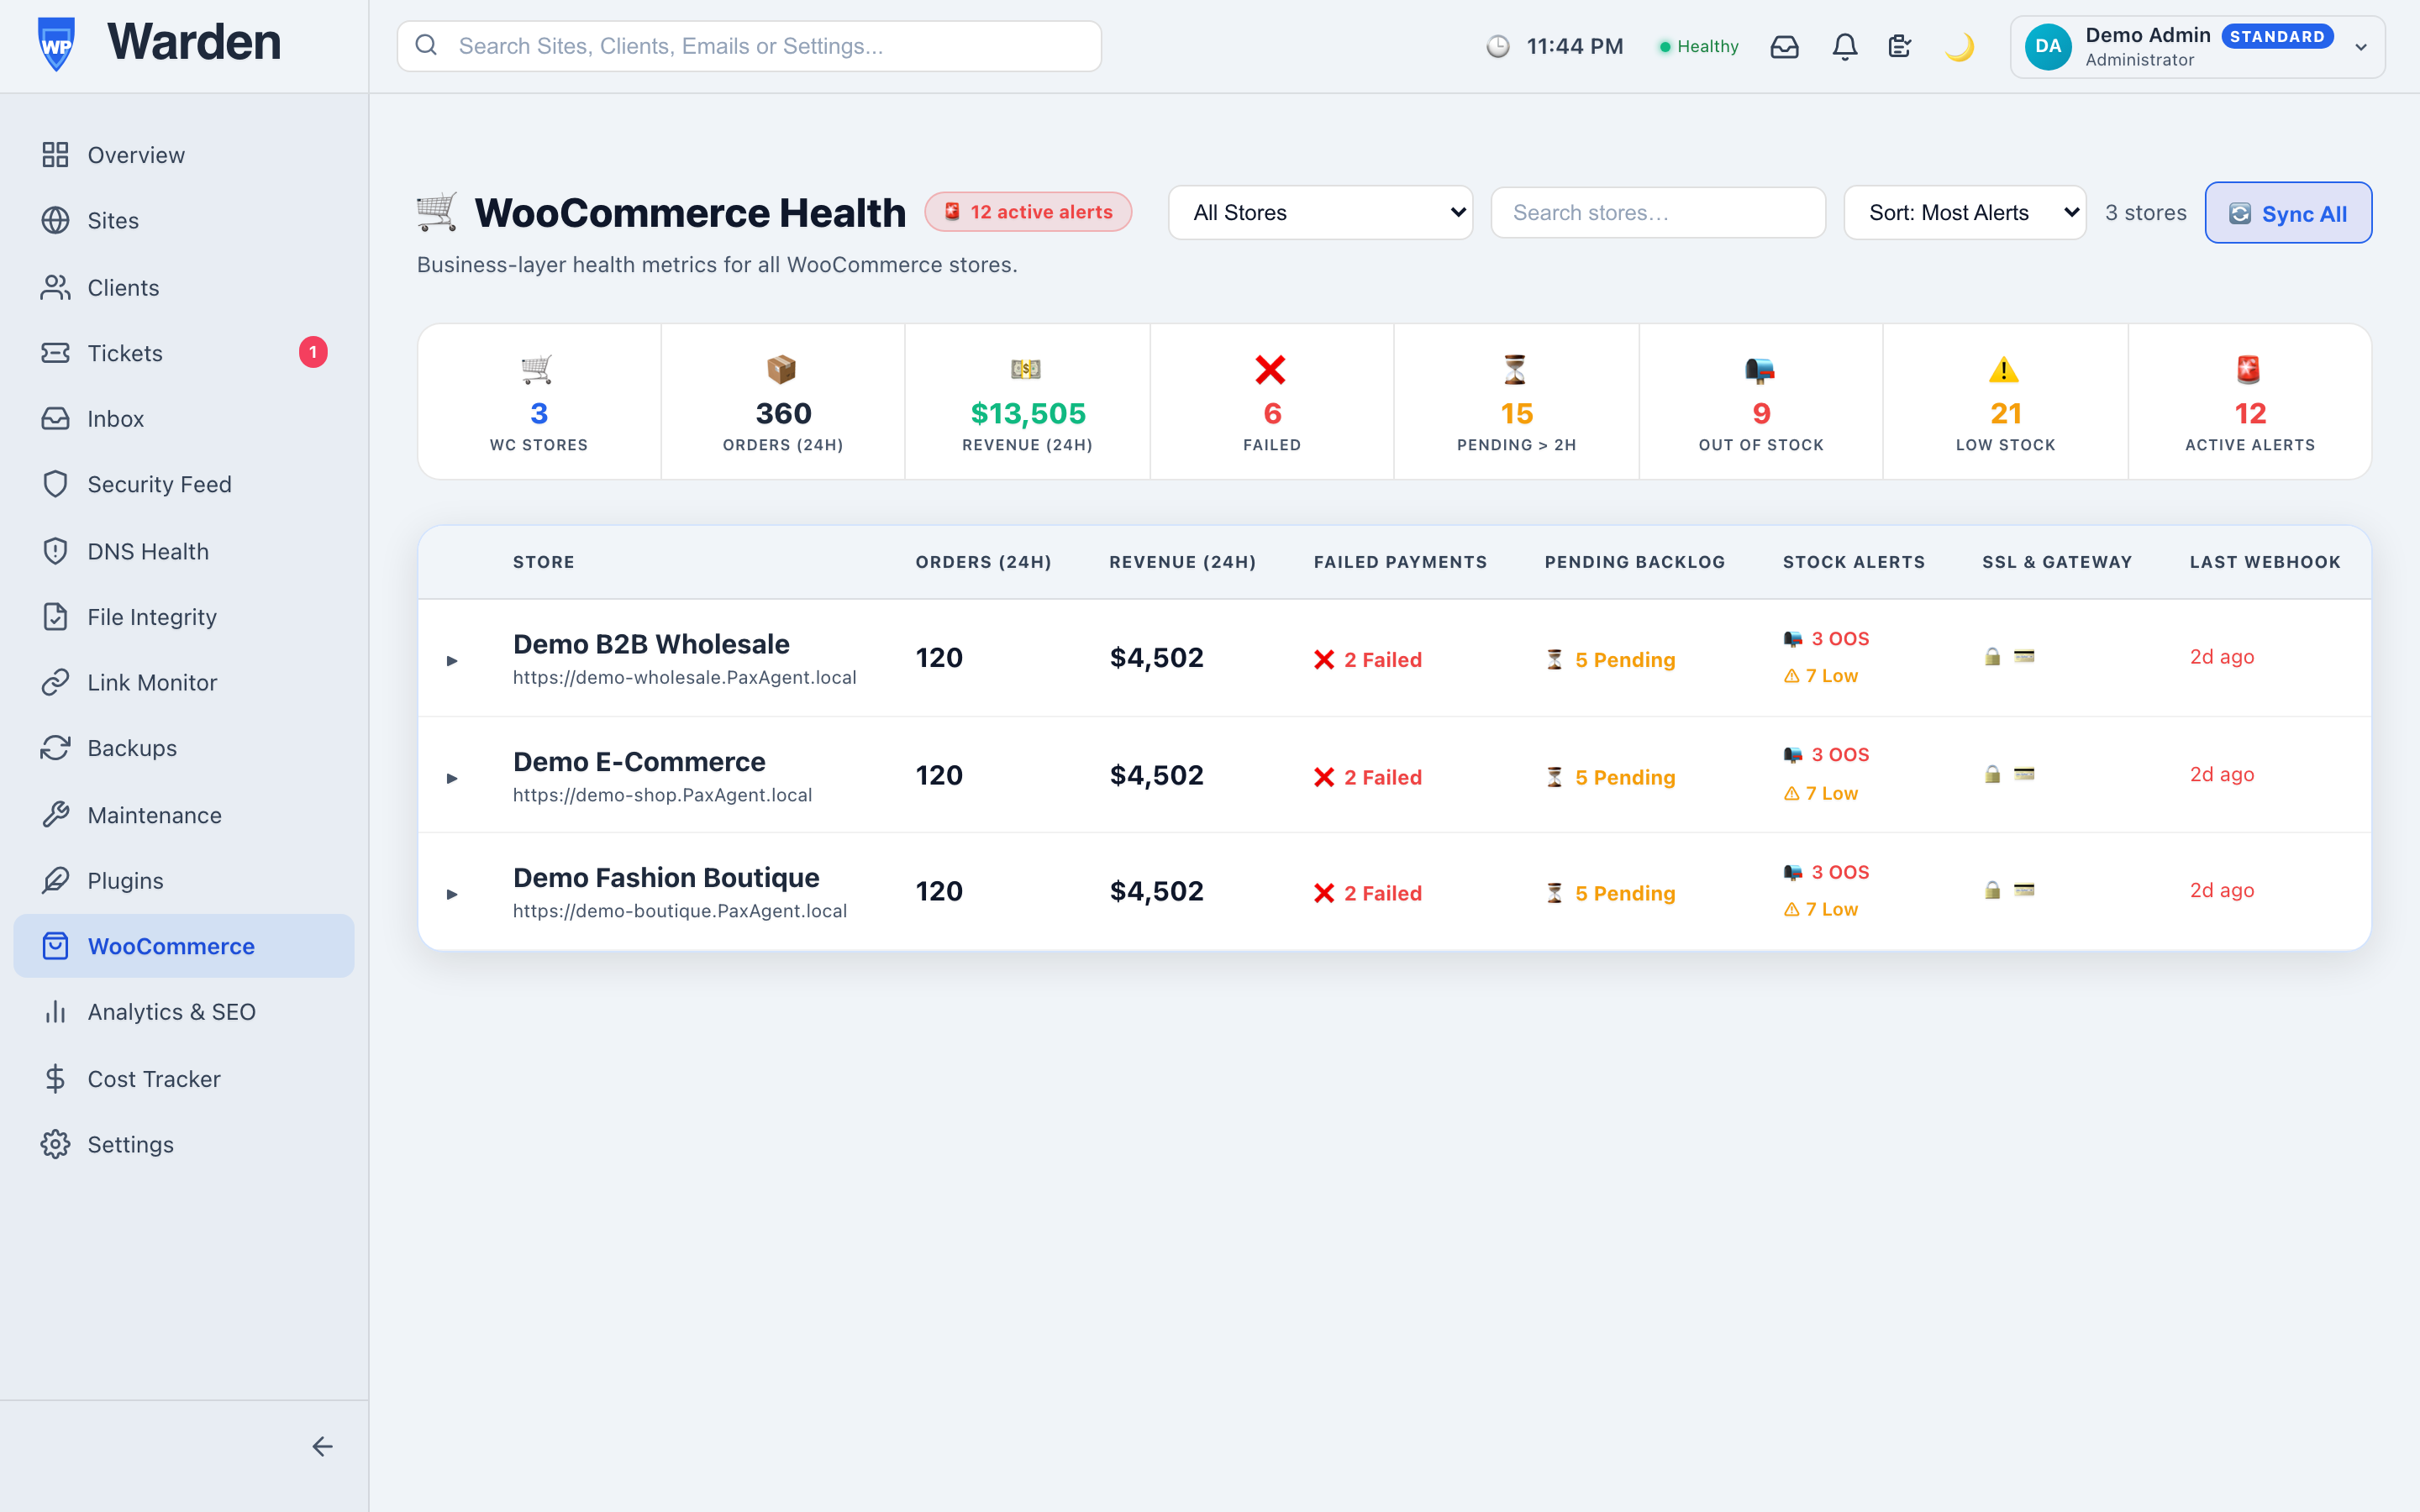
Back to that Tuesday afternoon outage. With revenue data sitting in the same view, the incident report can say something much more specific: the outage happened during a two-hour window that historically accounts for roughly this many orders, and here’s what recovery looked like immediately after. That’s a fundamentally different, more credible conversation than a purely technical summary — it speaks the language a client actually cares about, which is rarely uptime percentages and almost always dollars.
Generating WooCommerce REST API credentials takes a few minutes from the store’s own WooCommerce settings, and connecting them to WP Warden is a one-time step per store. The connection is read-only by default, meaning there’s no risk of an accidental change to orders or products from the monitoring side — it’s purely a window into data the store already generates on its own, not a new system that could interfere with how the store actually processes real transactions.
This matters most for agencies managing more than a couple of WooCommerce stores — below that, checking each store’s own admin individually is genuinely fine. Past that point, having revenue visible in the same fleet view you already check daily removes a real, recurring reason to open a separate tab for every single store, every single day, just to get a sense of how things are going commercially.
Real data, pulled directly from the store’s own REST API, not an estimate derived from general site activity.
For day-to-day site health and revenue overview, no — this brings both into the same view you already use for monitoring.
Start a free 14-day trial — no credit card required.
You’ve spent real effort building a white-label experience — your logo on the portal, your colors on the reports, your name on every interaction. Then a client’s monthly report lands in their spam folder because it was sent from a shared, generic domain with no sending reputation attached to your business at all. The branding was right. The plumbing underneath it wasn’t.
Email deliverability is, at its core, a reputation problem. A shared sending domain carries the sending history of everyone who’s ever used it — including anyone whose emails got marked as spam, whether or not that has anything to do with you. Your own domain, by contrast, carries only your own sending history. If you’ve been sending legitimate business email from it for years, that reputation actively works in your favor every time a new message goes out.
Connect your own SMTP server — host, port, username, password — once in WP Warden’s tenant settings, and every email the platform sends on your behalf, from client reports to alert notifications to ticket replies, goes out through that specific server instead of a generic shared default. Every email landing in a client’s inbox genuinely comes from your own domain, carrying your own reputation with it.
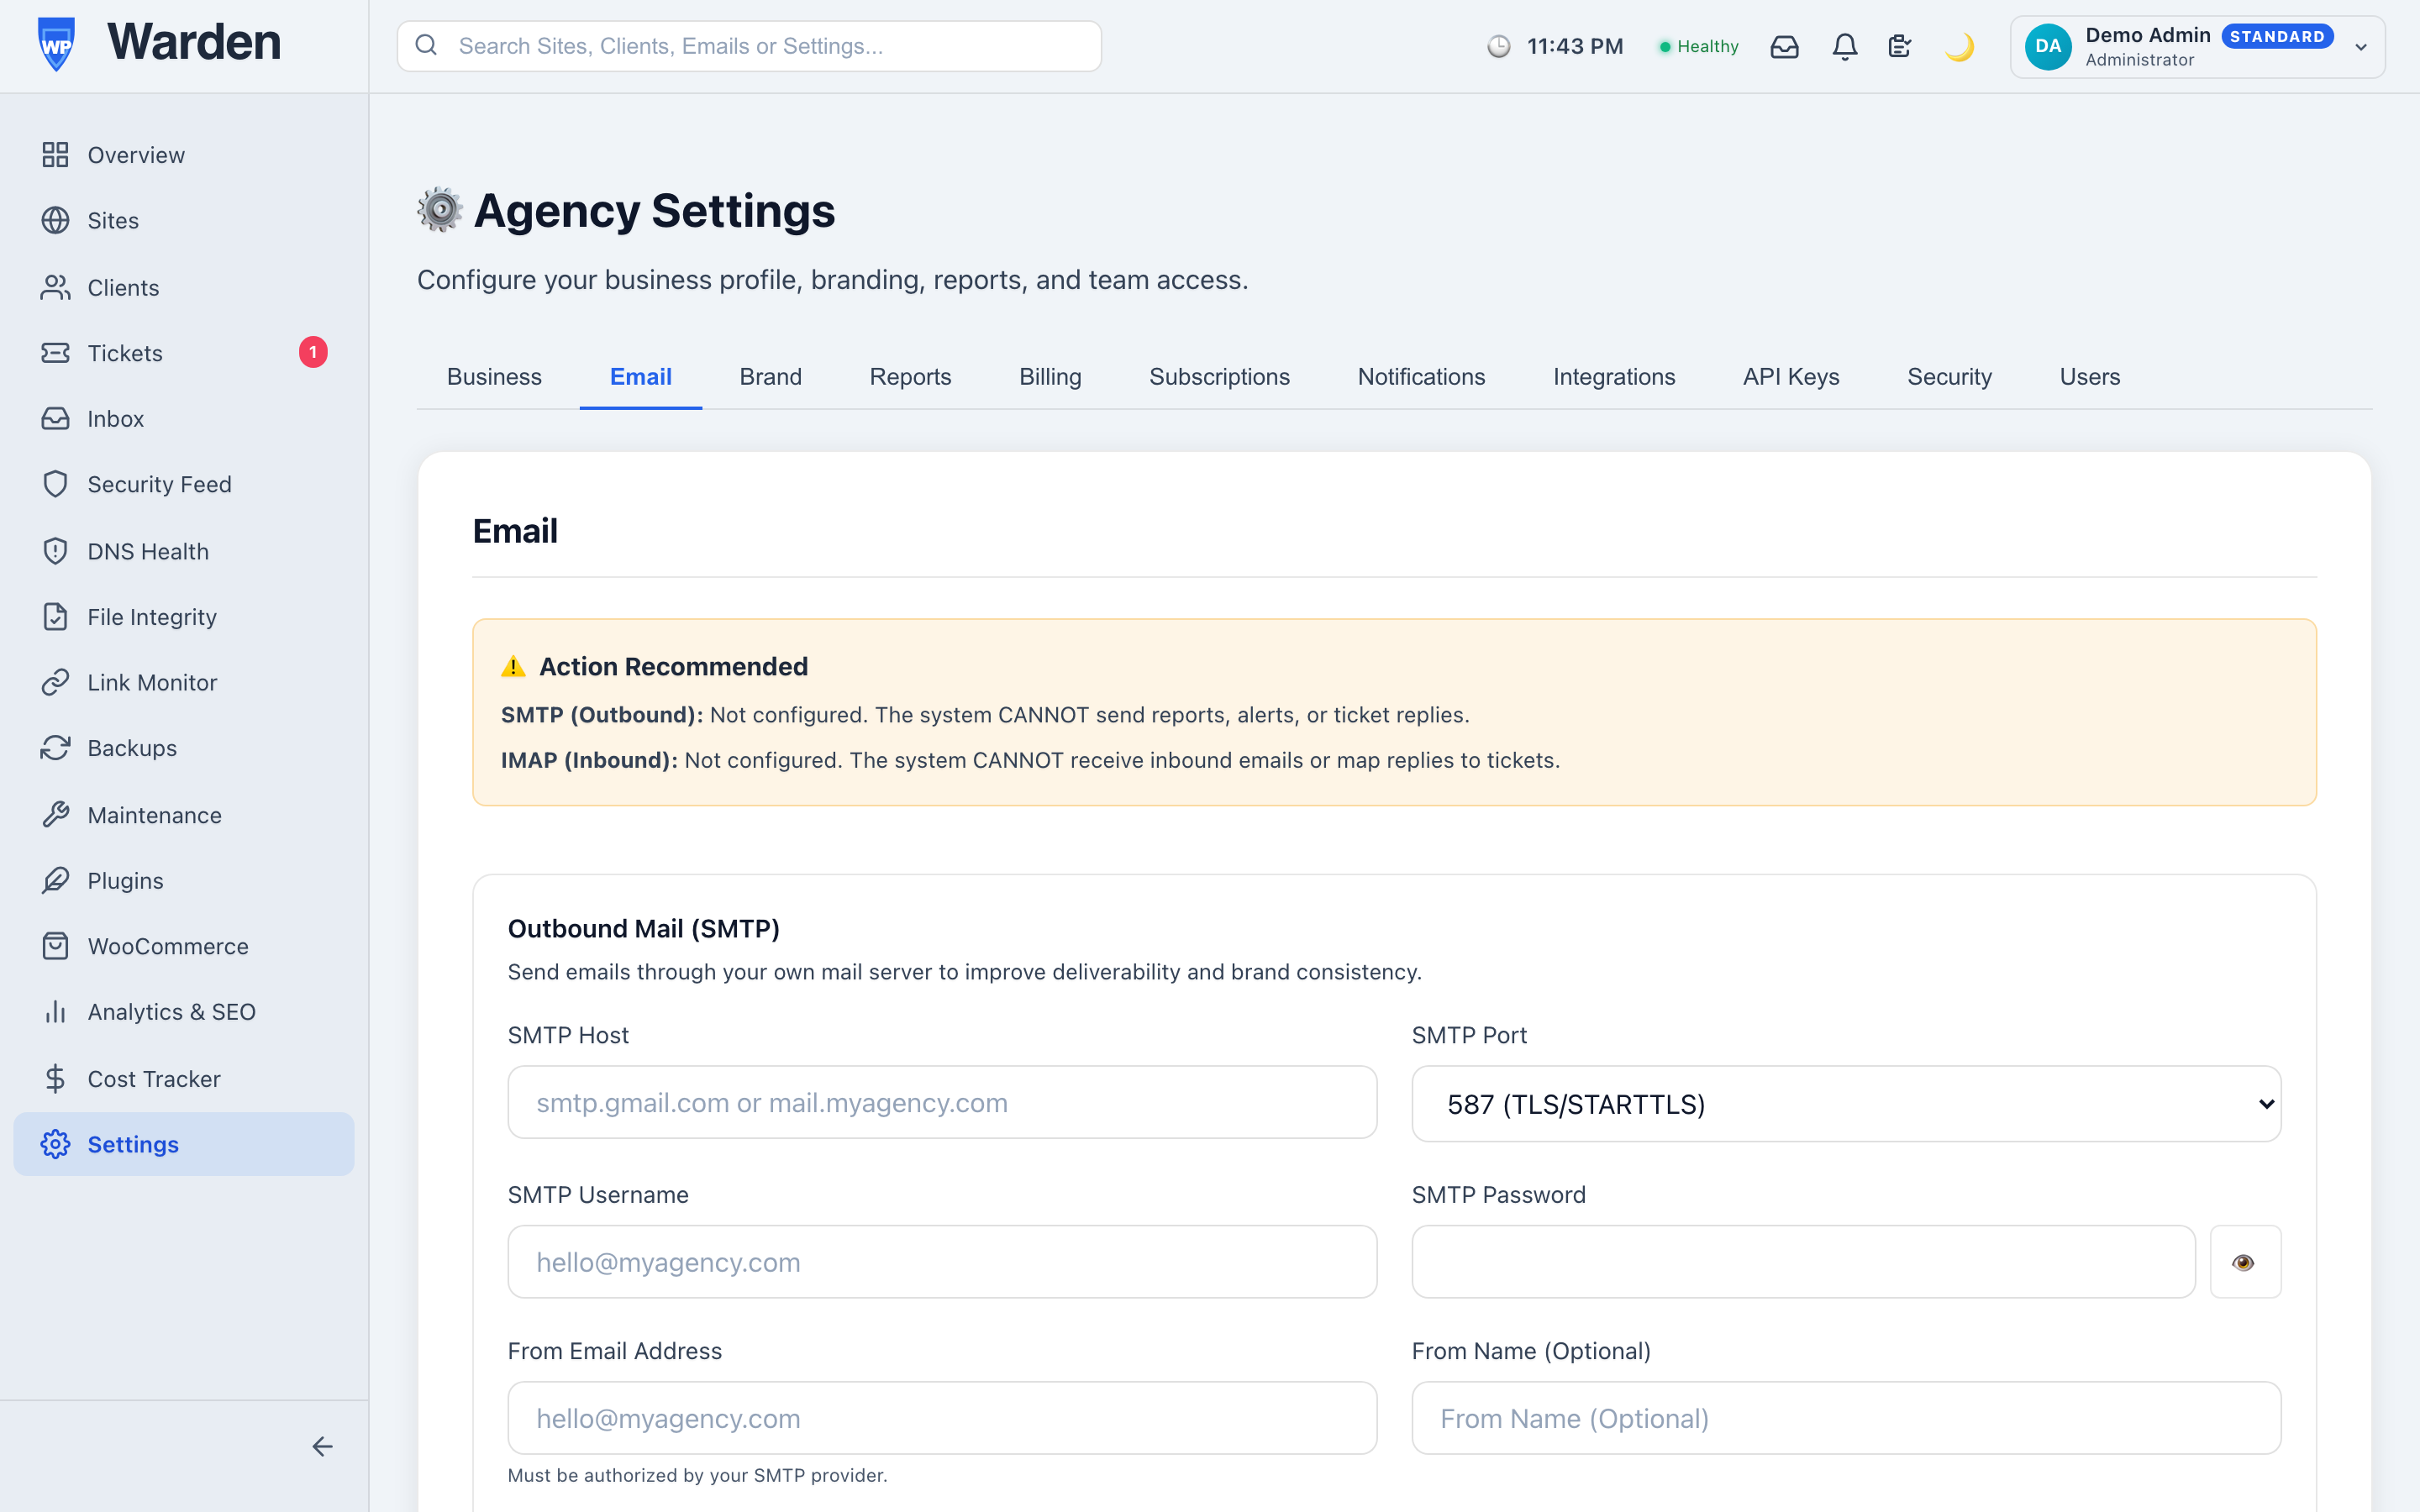
This is a genuine one-time setup, not a per-feature chore. Connect it once, and every feature that sends email — reports, alert notifications, ticket replies — uses it automatically. There’s no risk of configuring three of the four correctly and forgetting the fourth, because there’s only ever one place this gets set.
Entering SMTP credentials correctly and actually achieving good deliverability are two different milestones, and it’s worth confirming the second one rather than assuming it follows automatically from the first. Sending a real test report or alert to an account you control, and checking it lands in the primary inbox rather than spam, is a five-minute check worth doing once after setup — deliverability problems are far easier to notice and fix immediately than to discover months later when a client mentions they never got last quarter’s reports.
Connecting an existing business email account takes the same handful of fields any email client would ask for — host, port, username, and password, usually available directly from whatever provider already hosts your business email. There’s no need to purchase anything new or set up a dedicated sending service; if you already send business email from your own domain, that’s the exact account this plugs into.
Yes — reports, alert notifications, and ticket replies all route through your connected SMTP server once it’s configured.
No — one connection covers every email-sending feature on the platform automatically, with nothing further to configure.
Start a free 14-day trial — no credit card required.