A dashboard that only shows new information after a manual refresh isn’t really monitoring anything in real time — it’s monitoring on your schedule, whenever you next happen to hit F5, not the site’s schedule. The gap between those two things is exactly how a site can be down for twenty minutes before anyone on the team notices, purely because nobody happened to be looking at the right screen at the right moment.
A lot of dashboards that claim to be “real-time” are actually just polling — quietly re-checking every thirty or sixty seconds in the background and calling the delay negligible. Most of the time it is negligible. But the moment that matters most is exactly the moment a thirty-second delay stops being trivial: a site going down during a high-traffic launch window, a brute-force attack accelerating across several sites at once. Genuinely real-time means the update reaches you the instant it happens, full stop, not “within the next polling interval.”
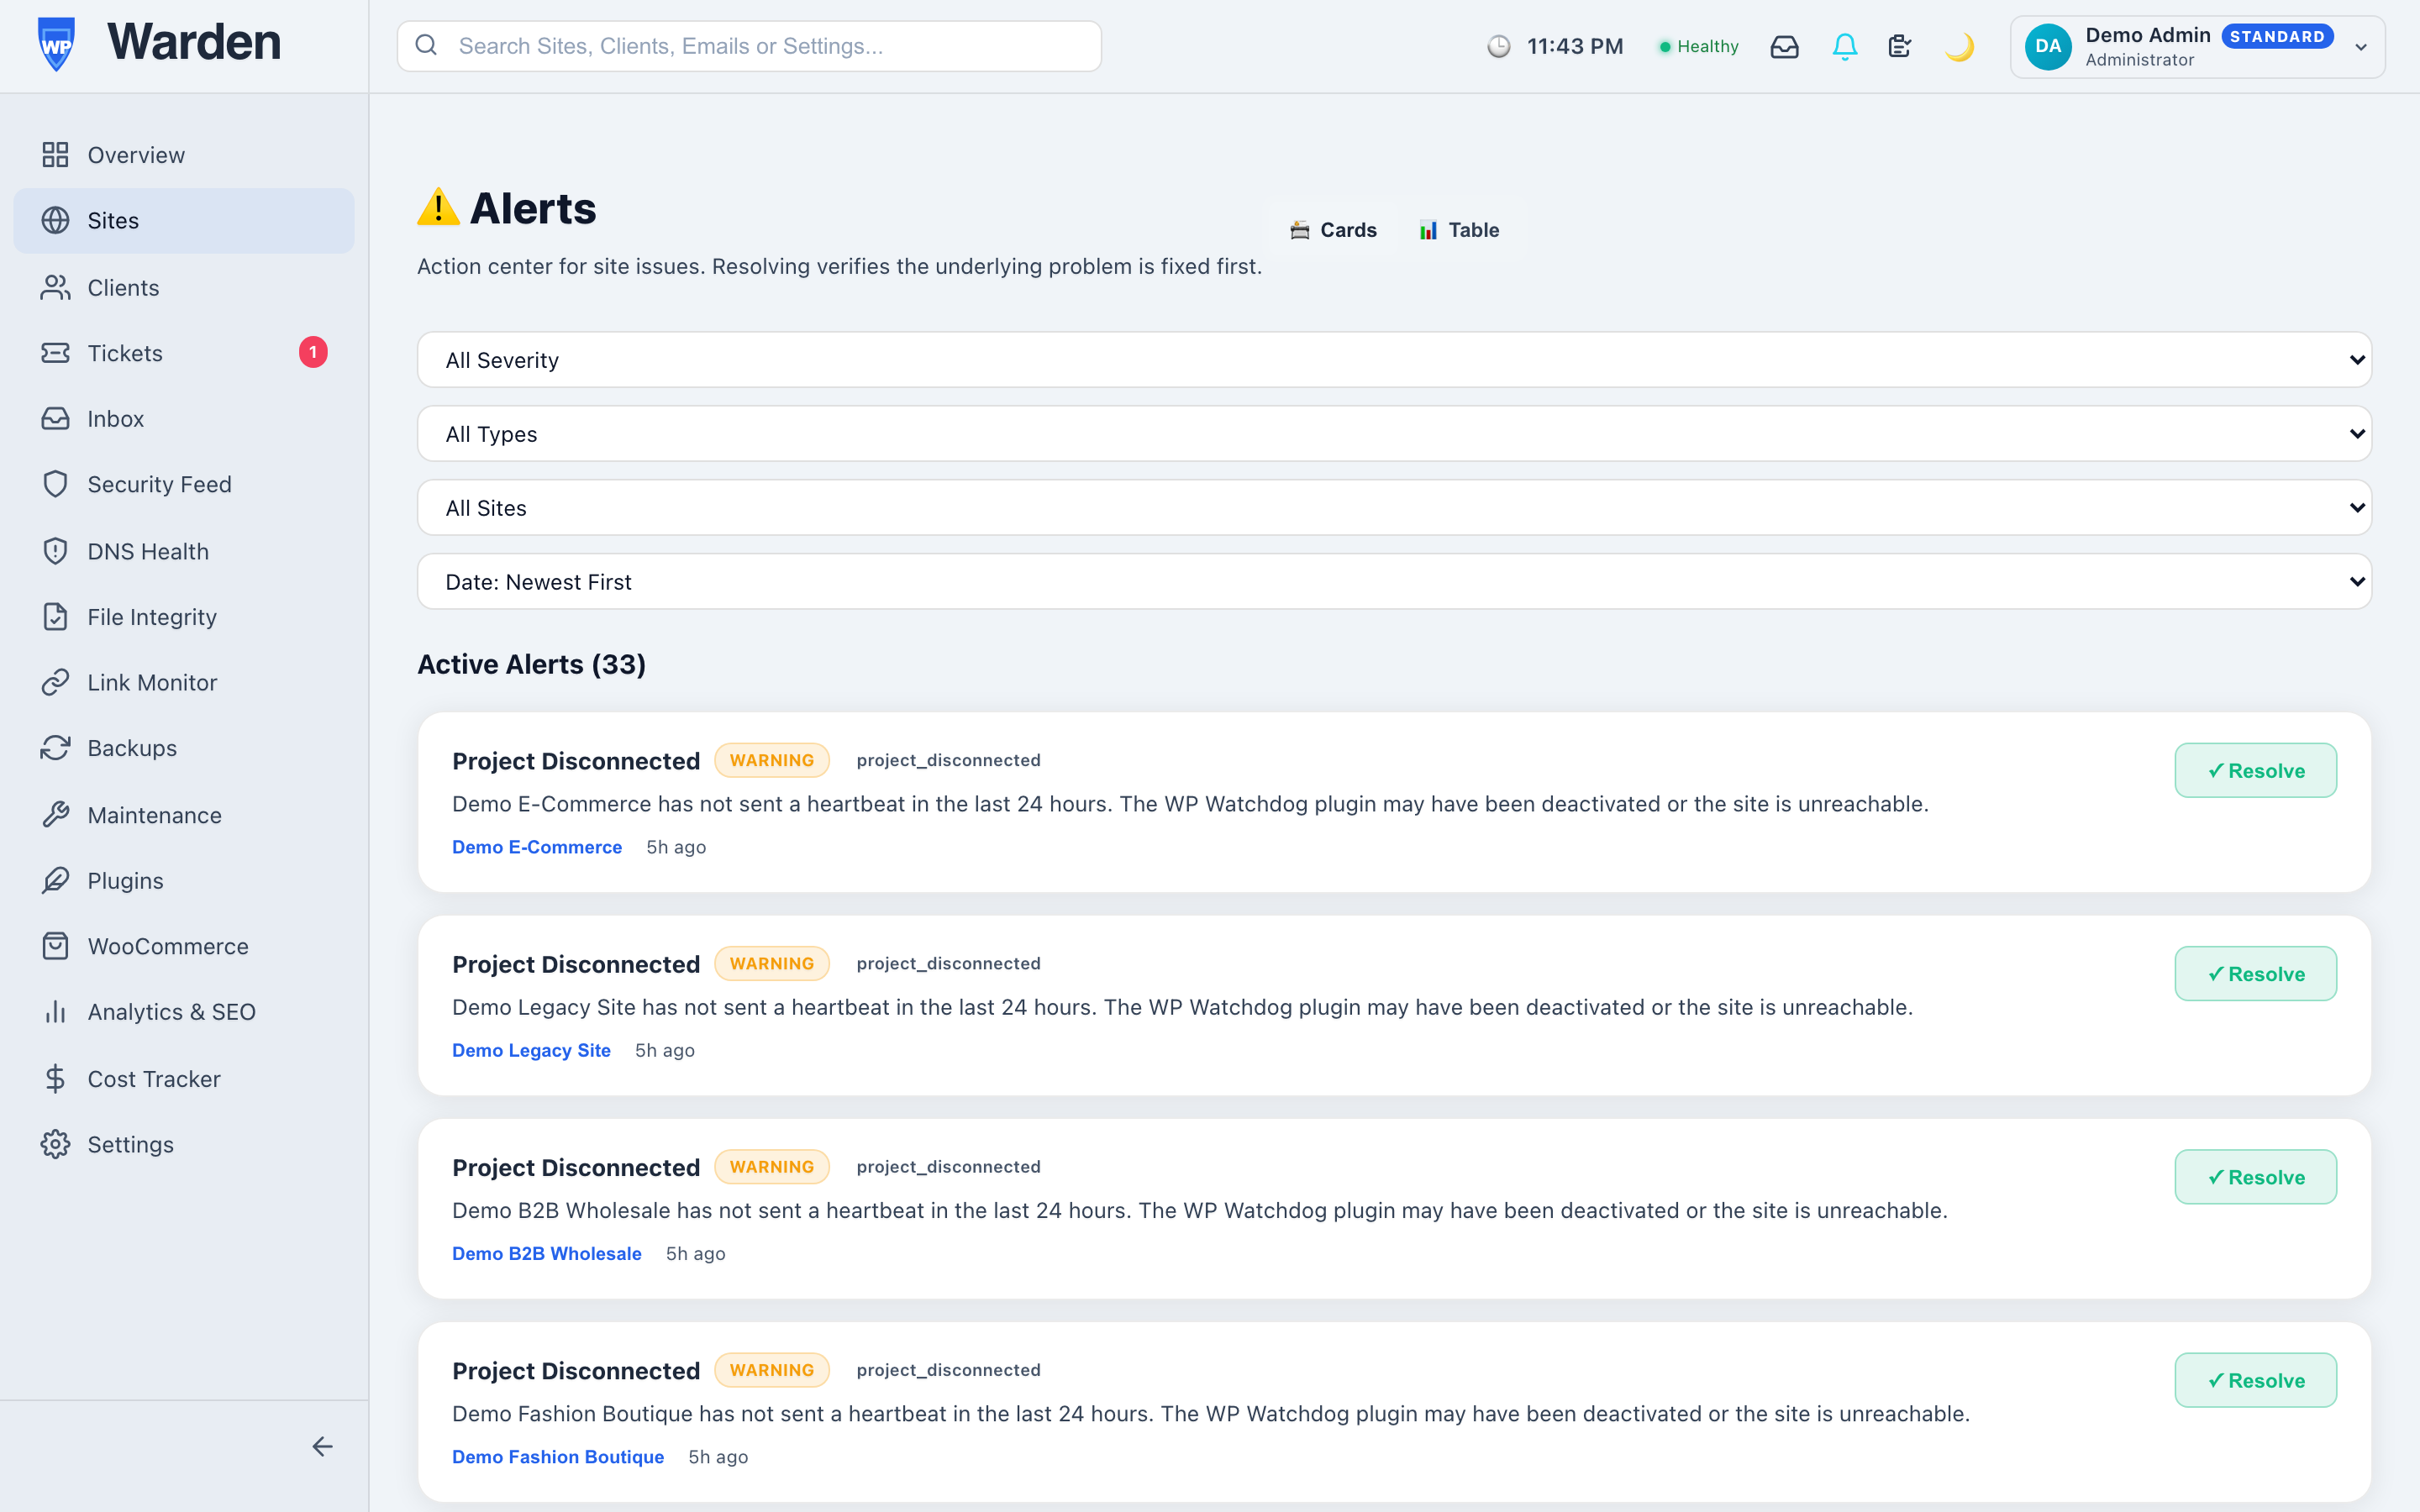
WP Warden’s notification system keeps a live WebSocket connection open between your browser and the dashboard’s backend. The moment a new alert is created, it appears — the alert badge updates live on every dashboard page, whether you’re actively looking at the alerts screen or somewhere else entirely working on a different client’s site.
Networks are unreliable in small, ordinary ways constantly — a laptop moving between wifi networks, a brief ISP hiccup, a server restart on the backend. A live connection that can’t recover from any of that quietly turns back into the same stale, refresh-dependent experience it was supposed to replace. WP Warden’s client reconnects automatically in the background the moment the connection is available again, with no action needed from you and no gap in coverage beyond the brief interruption itself.
Thirty seconds sounds negligible until you consider what can happen inside it during an active incident. A brute-force attempt can cycle through hundreds of password guesses in that window. A site under real load can go from struggling to fully unresponsive. The delay itself rarely causes the problem, but it does determine how far along the problem gets before a human even knows it’s happening — and that head start is exactly what a genuinely live connection removes.
The benefit compounds when more than one person is watching. Every team member with the dashboard open sees the same new alert at the same instant, without anyone needing to message the others that something’s happening. That shared, simultaneous awareness removes an entire category of coordination overhead — nobody has to be the one who notices first and tells everyone else, because everyone already knows at the same moment.
No — alerts arrive live over an open connection without any manual refresh required.
The client reconnects automatically in the background, with no action required from you and minimal gap in coverage.
Start a free 14-day trial — no credit card required.
Telling a client their SEO work is paying off, with nothing to back it up beyond “it feels like things are improving,” is a genuinely uncomfortable position to be in during a renewal conversation. A single ranking check today tells you where a keyword sits right now. It says nothing about whether that’s better than last month, worse than six months ago, or exactly where it’s always been — and that missing context is usually the actual thing a client wants to know.
SEO work is slow and cumulative by nature, which makes it uniquely hard to communicate about without real historical data. A ranking of position eight for a target keyword sounds mediocre in isolation — until you know it was position thirty-one three months ago, at which point it’s clearly evidence the work is doing exactly what it’s supposed to. Without the history, you’re stuck asking a client to just trust that progress is happening.
Add the keywords that matter for a site, and WP Warden’s keyword tracking follows their search engine ranking over time, building a historical record of how that ranking has moved up or down — directly from the same dashboard where you already manage the site, with no separate SEO tool subscription required just to see a trend line.
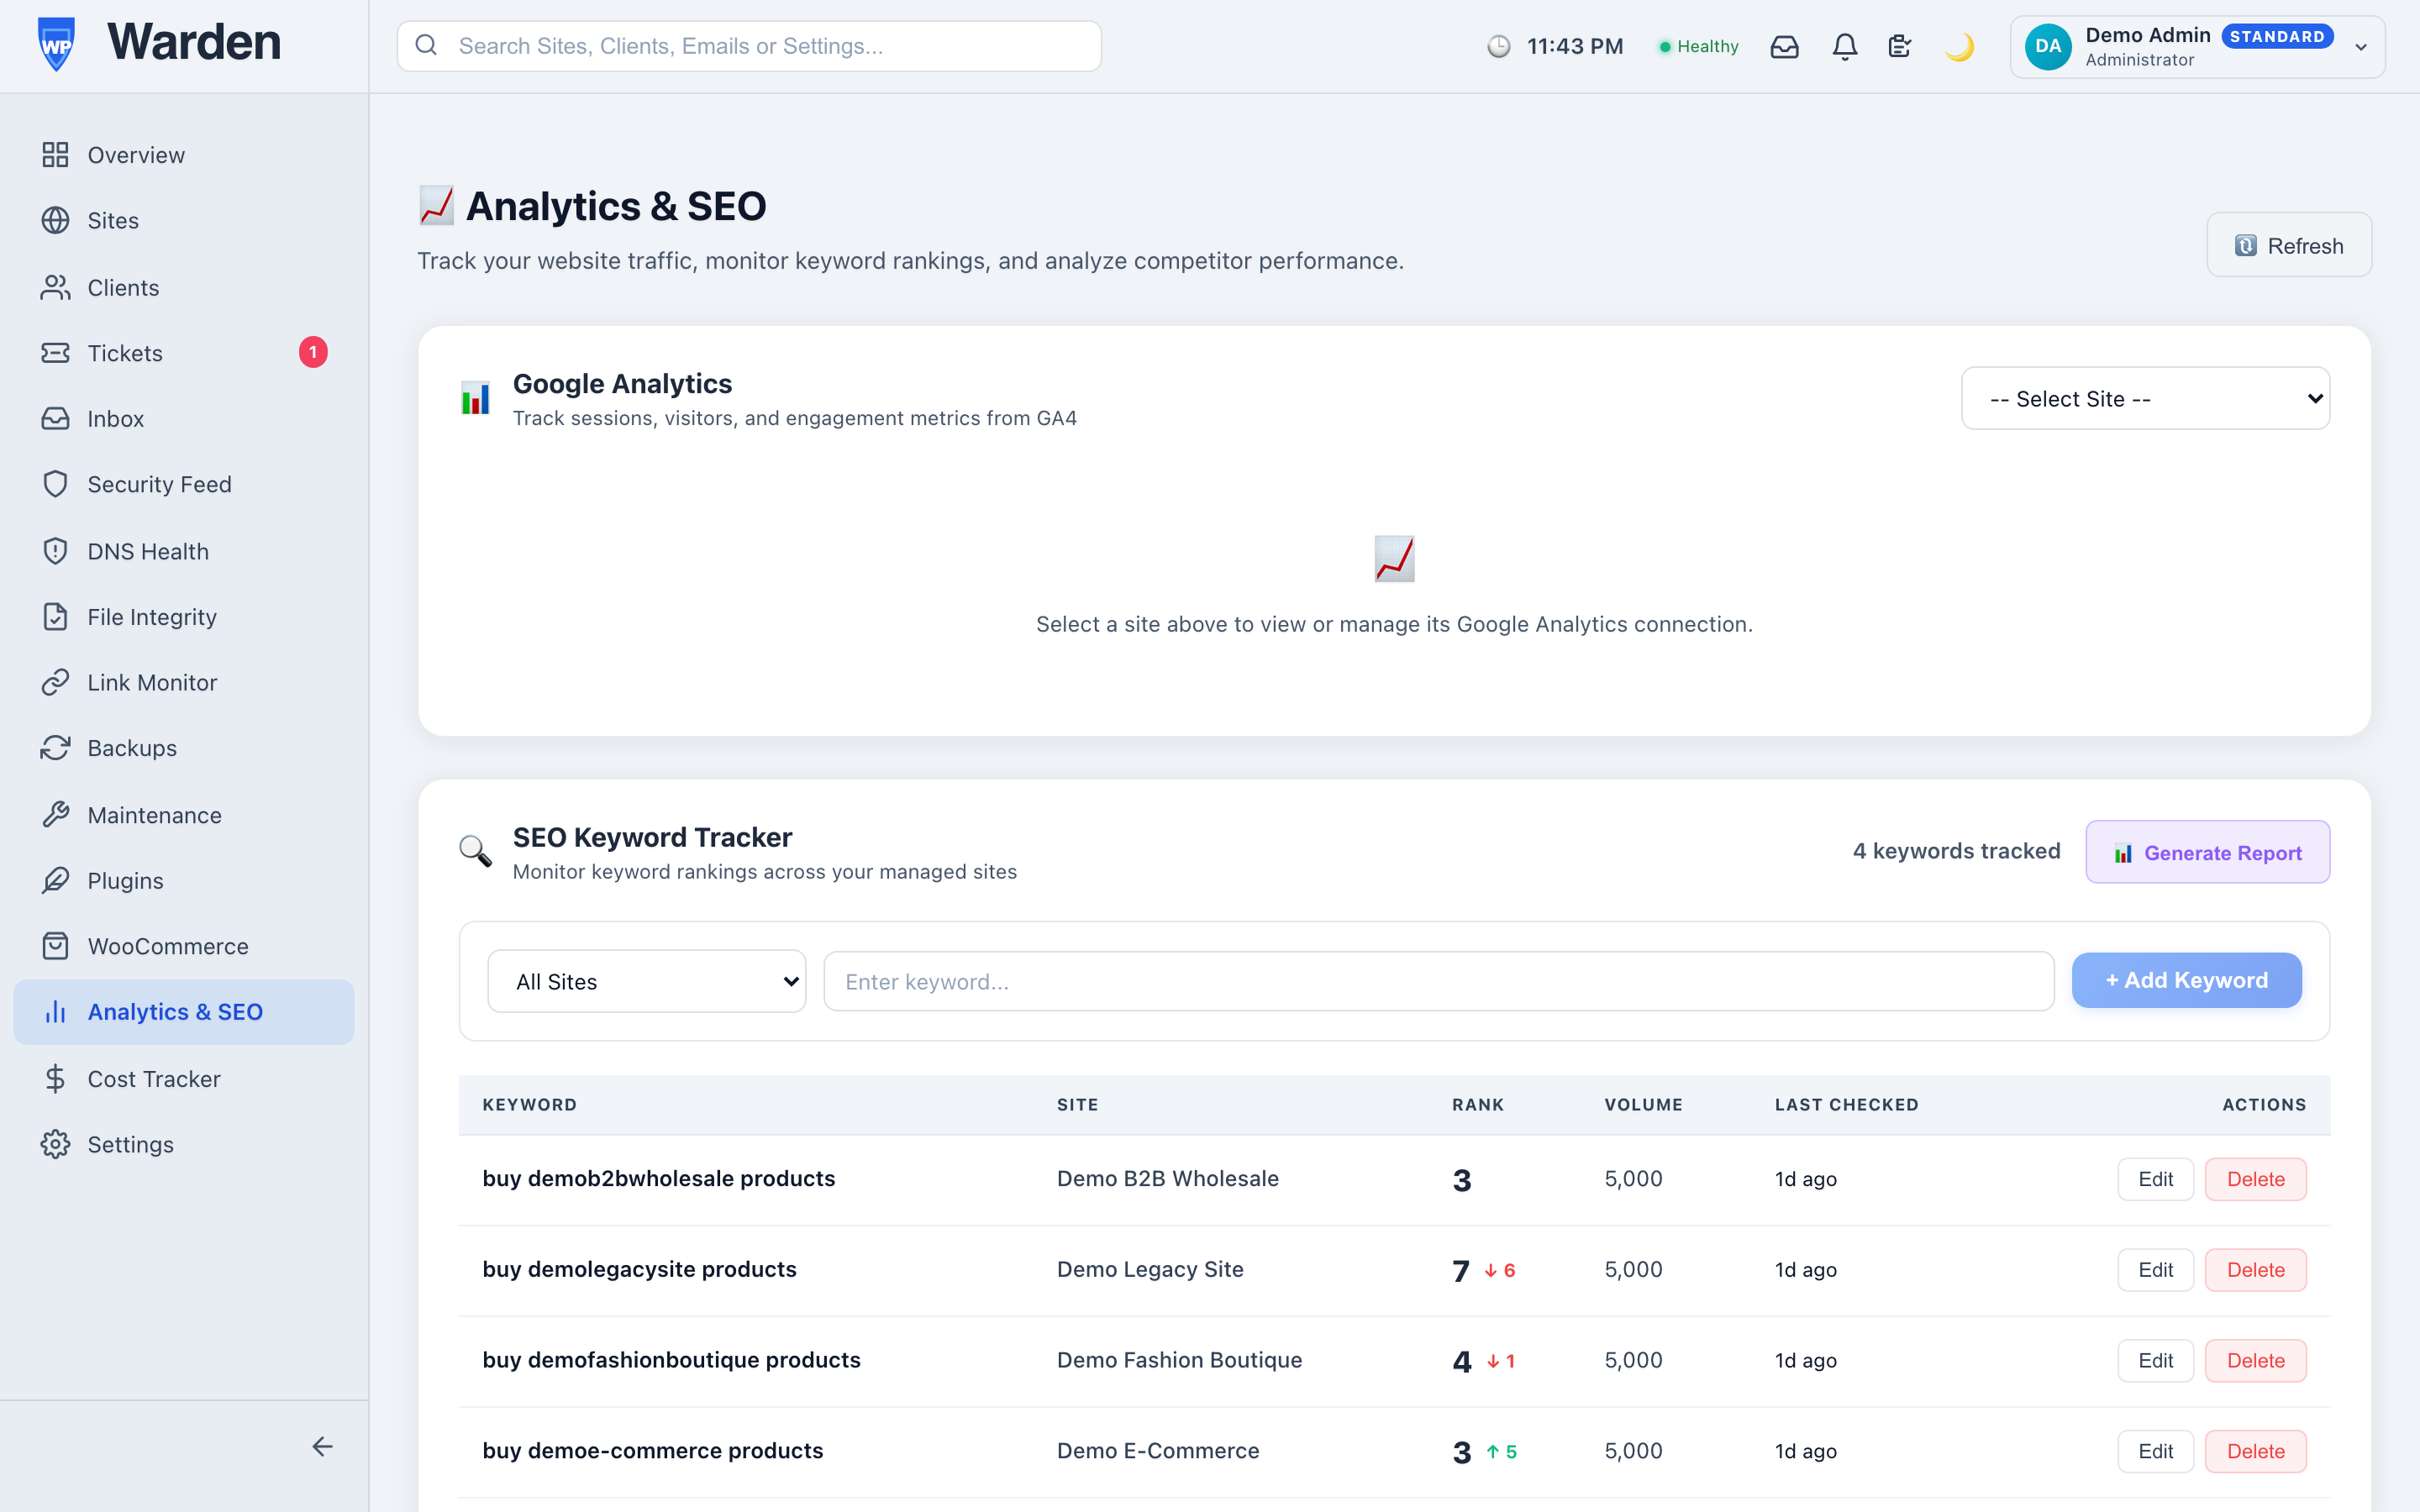
A ranking chart trending upward over six months is a far more convincing renewal argument than a verbal assurance ever will be, precisely because it doesn’t rely on the client trusting your word for it — the data speaks for itself. The same data works in the other direction too: a sudden drop on an important keyword is worth investigating immediately, since it can point to a real technical issue on the site or a broader search engine algorithm shift worth knowing about before a client notices the traffic dip on their own. Pairing this with real visitor numbers from Google Analytics for the same site rounds out the picture — not just rank movement, but whether it’s translating into actual traffic.
Tracking every keyword a site could plausibly rank for produces a dashboard nobody actually reads. A more useful approach is tracking a deliberately short list: the handful of terms directly tied to what the business sells, plus one or two aspirational terms worth stretching toward. That’s usually five to fifteen keywords per site, not fifty — few enough that a genuine movement in any one of them is noticeable rather than buried in a wall of numbers nobody has time to scan.
No — keyword tracking runs directly from the same site management dashboard, with no external tool needed for this core function.
Ongoing — the real value is in the trend built up over time, not a single isolated ranking snapshot with no context.
Start a free 14-day trial — no credit card required.
A serious vulnerability drops in a plugin you know is popular. Somewhere in the back of your mind you’re fairly sure a few client sites run it — but “fairly sure” isn’t good enough when the clock is running, and finding out for certain the old way means opening wp-admin for every single site on your list and checking one by one. That’s exactly the moment fleet-wide plugin visibility stops being a nice-to-have and starts being the thing standing between you and a very bad phone call.
WP Warden’s plugin and theme management shows every installed plugin and theme across your entire fleet in one view, with real icons pulled from the plugin itself or the ps.w.org CDN so you can tell them apart visually rather than parsing a long list of similarly-worded names. Toggling activation, triggering updates, and filtering by status, site, or search text all run through the same reliable command queue that powers every other remote action in WP Warden — nothing about this is a separate, bolted-on system.
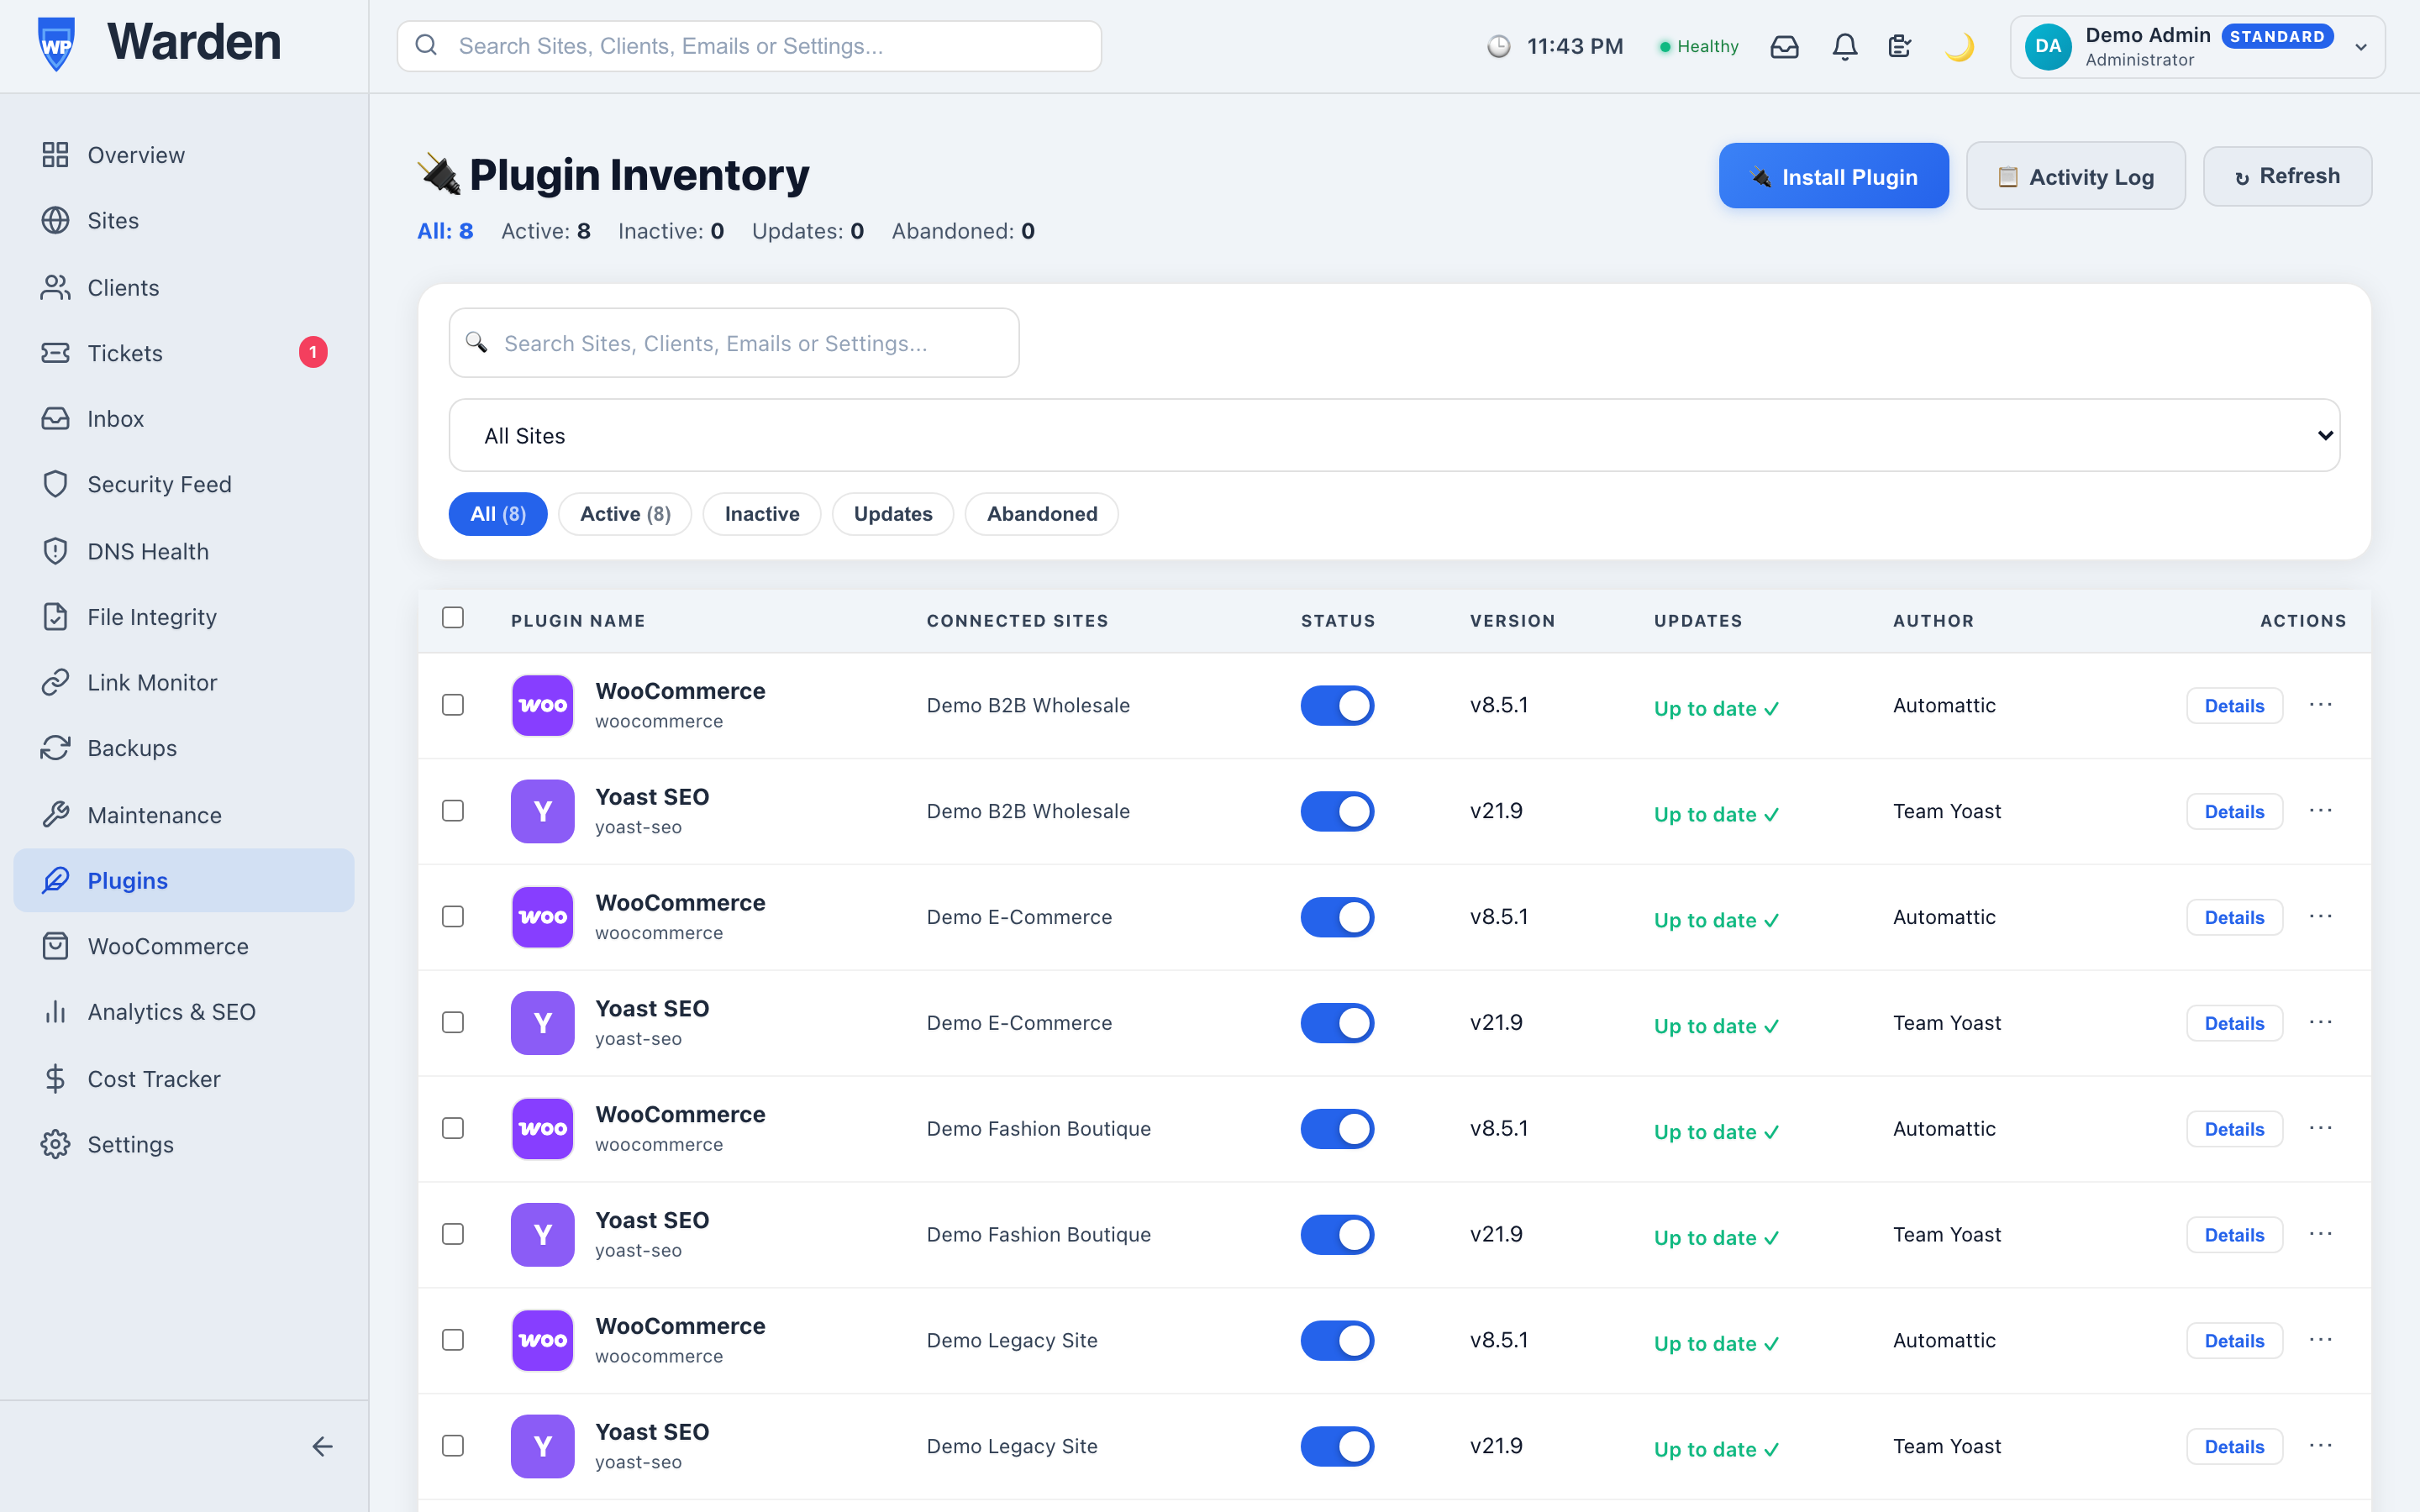
Back to that vulnerability. A quick search across the fleet view answers the only question that matters — which sites actually run this plugin — in seconds, not the better part of an afternoon spent logging in one at a time. From there, updating every affected site happens in the same view, without needing to context-switch into each site’s own admin area at all. The gap between “there’s a CVE out for this” and “every affected site is patched” shrinks from hours to minutes, and that gap is exactly what determines whether you’re ahead of an opportunistic scanner or behind it.
It’s worth using this view outside of an emergency too. A periodic scan of what’s actually installed across a fleet tends to surface things you’d never notice site by site: three different SEO plugins doing the same job across different clients, an abandoned plugin nobody remembers adding, a theme that’s years out of date on a site that otherwise looks fine. None of these are urgent individually, but cleaning them up periodically is a lot easier when you can see the whole pattern at once instead of stumbling onto it by accident on one site.
New plugins reach a site through the same view too — browsing and installing directly from WordPress.org without ever logging into the target site individually.
It’s worth scheduling a periodic pass through this view even when nothing’s on fire. A quarterly review of what’s actually installed across a fleet tends to surface small, low-urgency findings that never justify their own investigation individually — an abandoned plugin nobody remembers adding, three different SEO tools doing overlapping jobs across different clients, a theme that’s years behind current. None of it is an emergency. All of it is easier to clean up in a single sweep than to notice one site at a time, months apart, by accident.
Yes — real filtering and search across the fleet finds every affected site immediately, without checking each one individually.
For activation, updates, and installation, yes — all of it runs through the same remote command channel, with no need to log into the site directly.
Start a free 14-day trial — no credit card required.
A broken “buy now” button doesn’t announce itself. It just sits there, quietly costing real money every minute nobody notices, until a customer finally gets frustrated enough to email — or, more often, just leaves without saying anything at all. A broken internal link is the same story with a slower fuse: it doesn’t lose you a sale today, it loses you a little search ranking every week it goes unfixed.
WP Warden’s link monitor checks every URL you add — an internal page, an external partner link, a checkout button, anything you actually care about — every five minutes with a lightweight HEAD request. It doesn’t crawl the whole site indiscriminately looking for links to check; you add exactly the ones that matter, which keeps the checks fast and the results actually meaningful instead of a flood of low-priority noise from links nobody cares about.
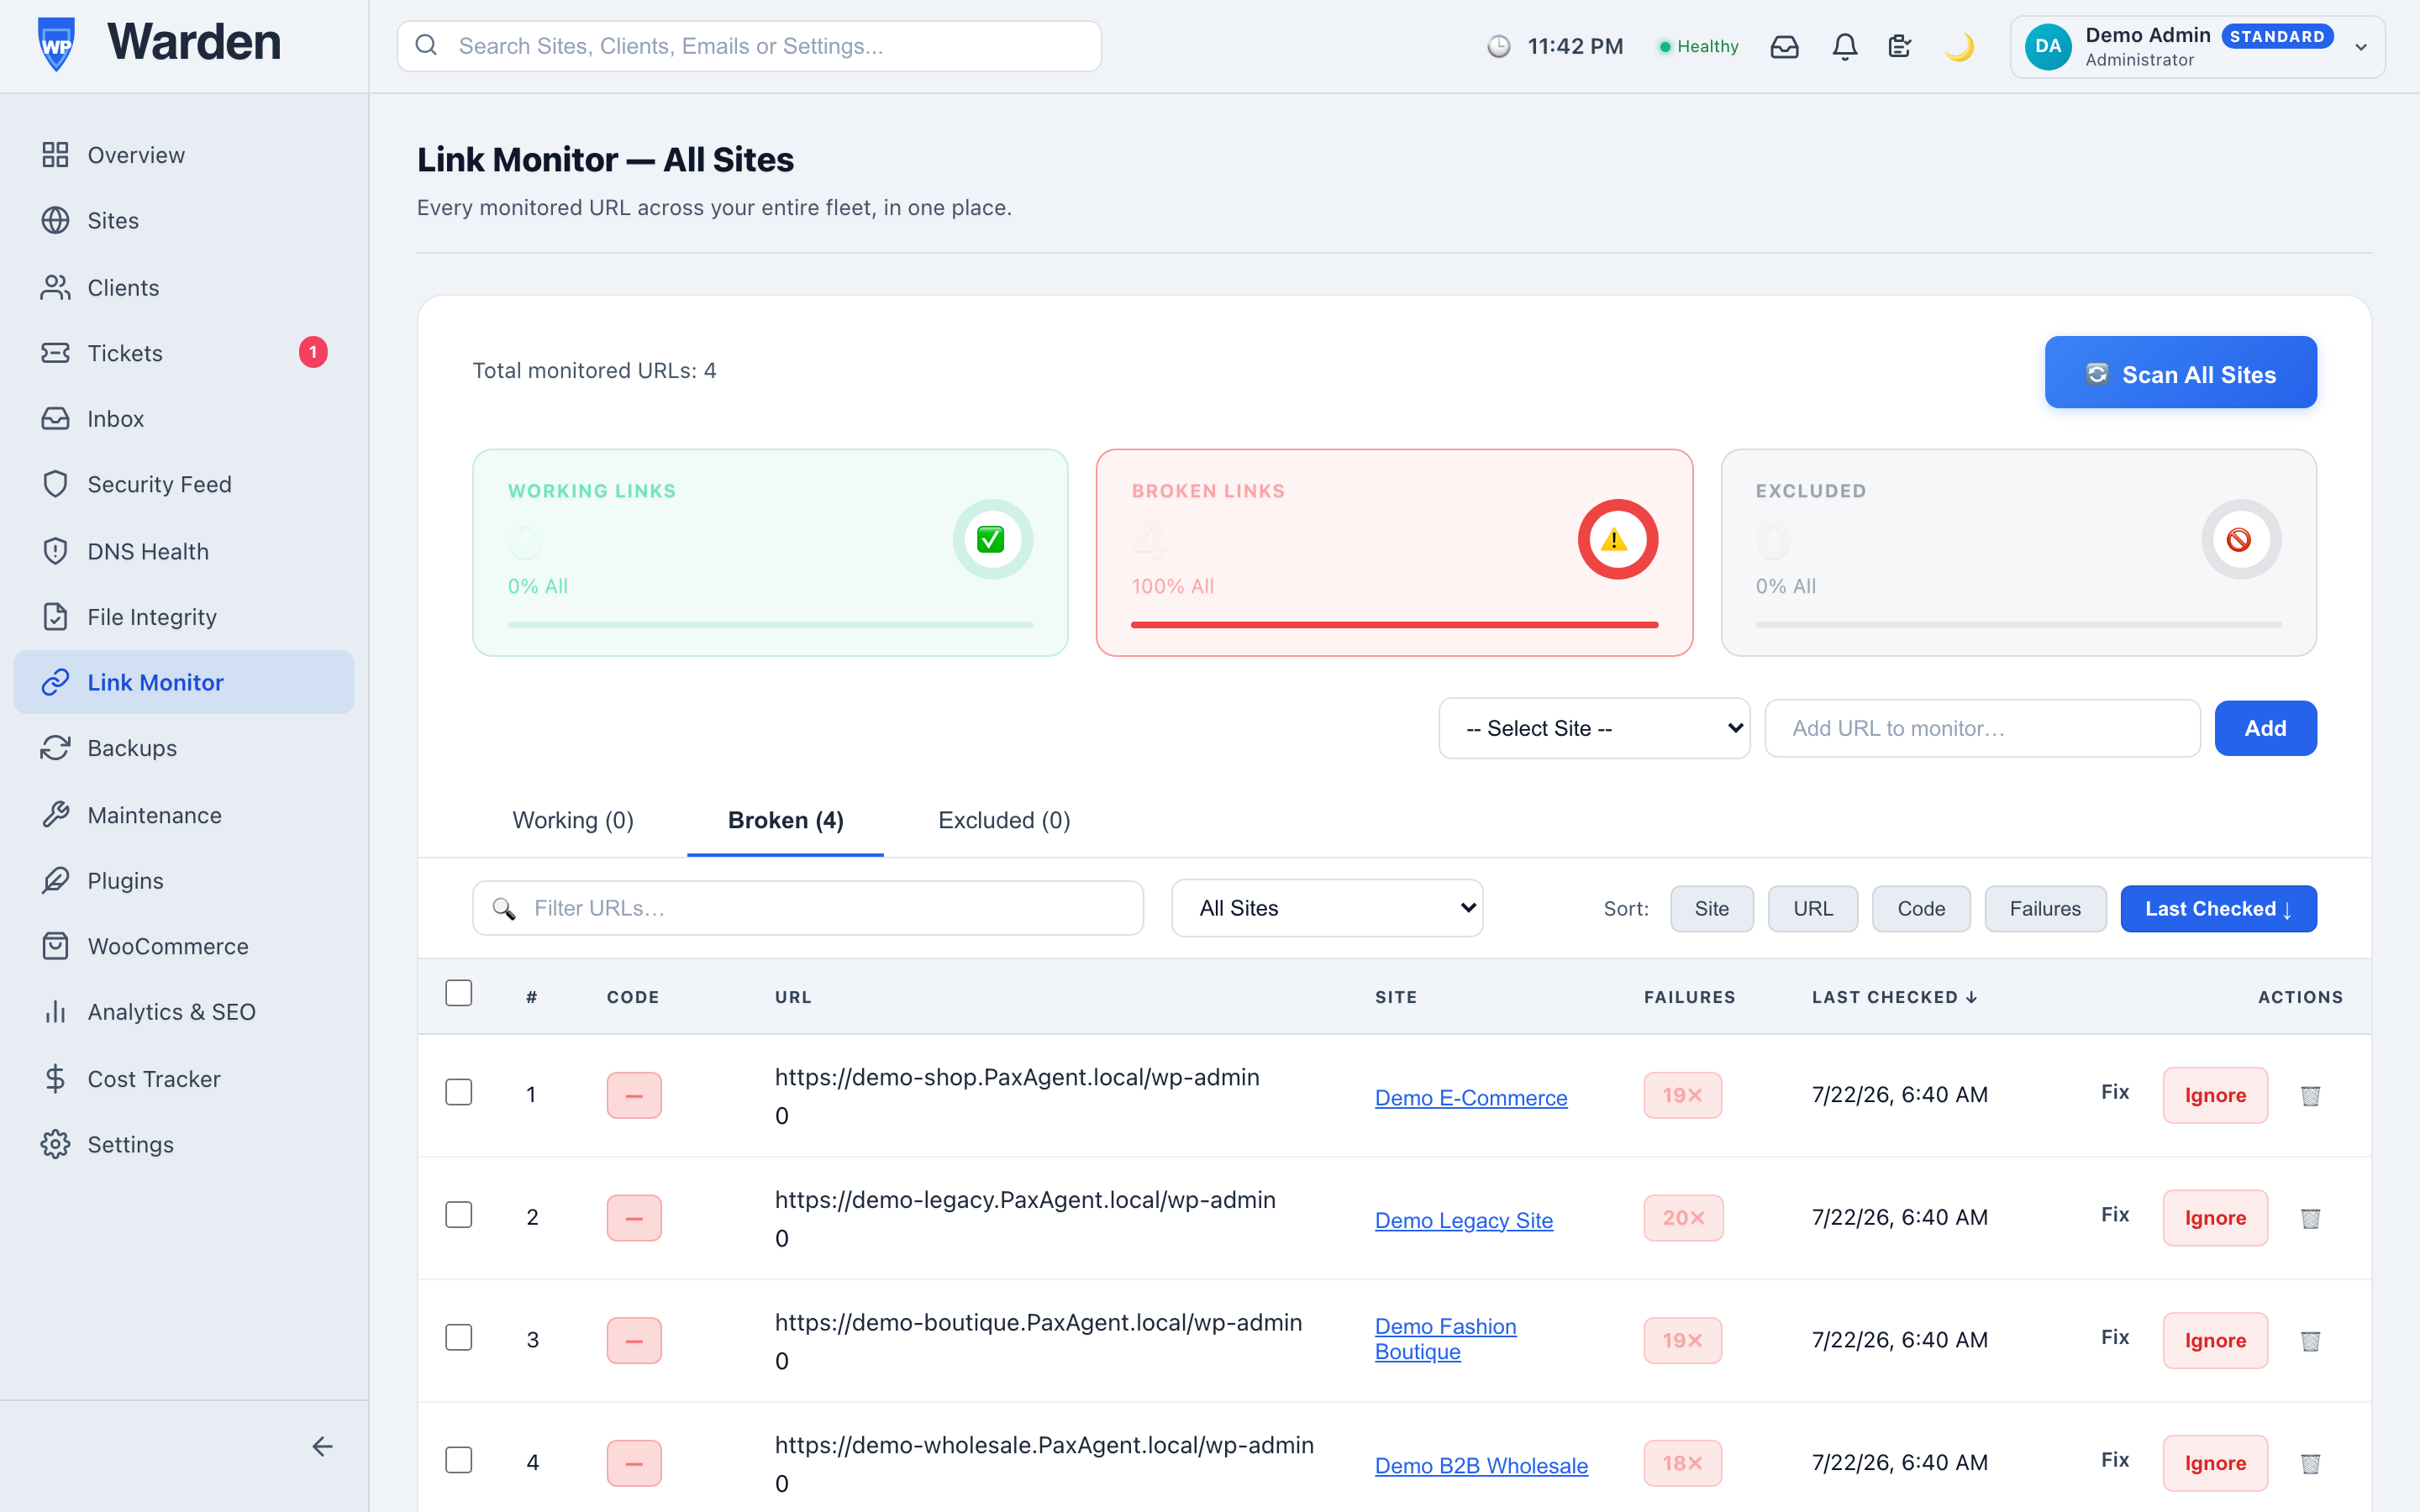
A momentary network blip happens more often than most people realize — a five-second DNS hiccup, a server briefly overloaded, a CDN having a bad minute. If a single failed check triggered an alert, you’d spend half your week investigating things that fixed themselves before you even opened the dashboard. A configurable failure-count threshold means a link only gets reported once it’s actually, repeatedly unreachable — turning “maybe broken” into “genuinely broken” before it ever reaches you.
Two categories of link tend to matter disproportionately more than the rest of the site: revenue links and partnership links. A broken checkout button costs sales in real time; a dead affiliate or partner link quietly costs commission every day it stays broken, often on a link you set up once and never look at again unless something reminds you to. Both are exactly the kind of thing worth adding to a monitored list specifically, rather than hoping you’ll notice during a routine site check that may not happen for weeks.
The temptation with any monitoring tool is to add everything, but a genuinely useful link-monitoring list is a curated one, not an exhaustive one. Worth adding: anything tied directly to revenue (checkout buttons, payment links), anything tied to a partnership or affiliate relationship where you don’t control the destination, and any link a client has specifically asked you to keep an eye on. Worth leaving off: routine internal navigation that a standard site crawl or SEO audit would catch anyway on its own schedule. The goal is a short list of links where a failure genuinely matters enough to justify a five-minute check every five minutes, not a comprehensive inventory of every link on the site.
No — a configurable failure threshold has to be crossed first, so a passing network hiccup never creates a false alarm on its own.
No — you add exactly the links you want tracked, rather than an indiscriminate scan of everything on every page.
Start a free 14-day trial — no credit card required.
Here’s a scenario that catches even experienced agencies off guard: uptime monitoring shows green across the board, the site loads fine for every visitor, and yet the last successful backup was three weeks ago. Nothing looks wrong from the outside because nothing actually is wrong from the outside — the front end never depended on the thing that’s broken. wp-cron quietly stopped firing, and every scheduled task riding on it has been silently failing ever since.
WordPress’s own wp-cron is what quietly drives scheduled backups, security scans, and a long list of other maintenance tasks in the background. It’s also, by design, triggered by page visits rather than a true system-level scheduler — which means a host blocking outbound requests, a fatal PHP error somewhere in the chain, or a misconfigured server can silently break it while the site itself keeps serving every visitor a perfectly normal page. An uptime check measures exactly that — can a visitor reach the site — and by definition has no way to see a failure that never touches the front end at all.
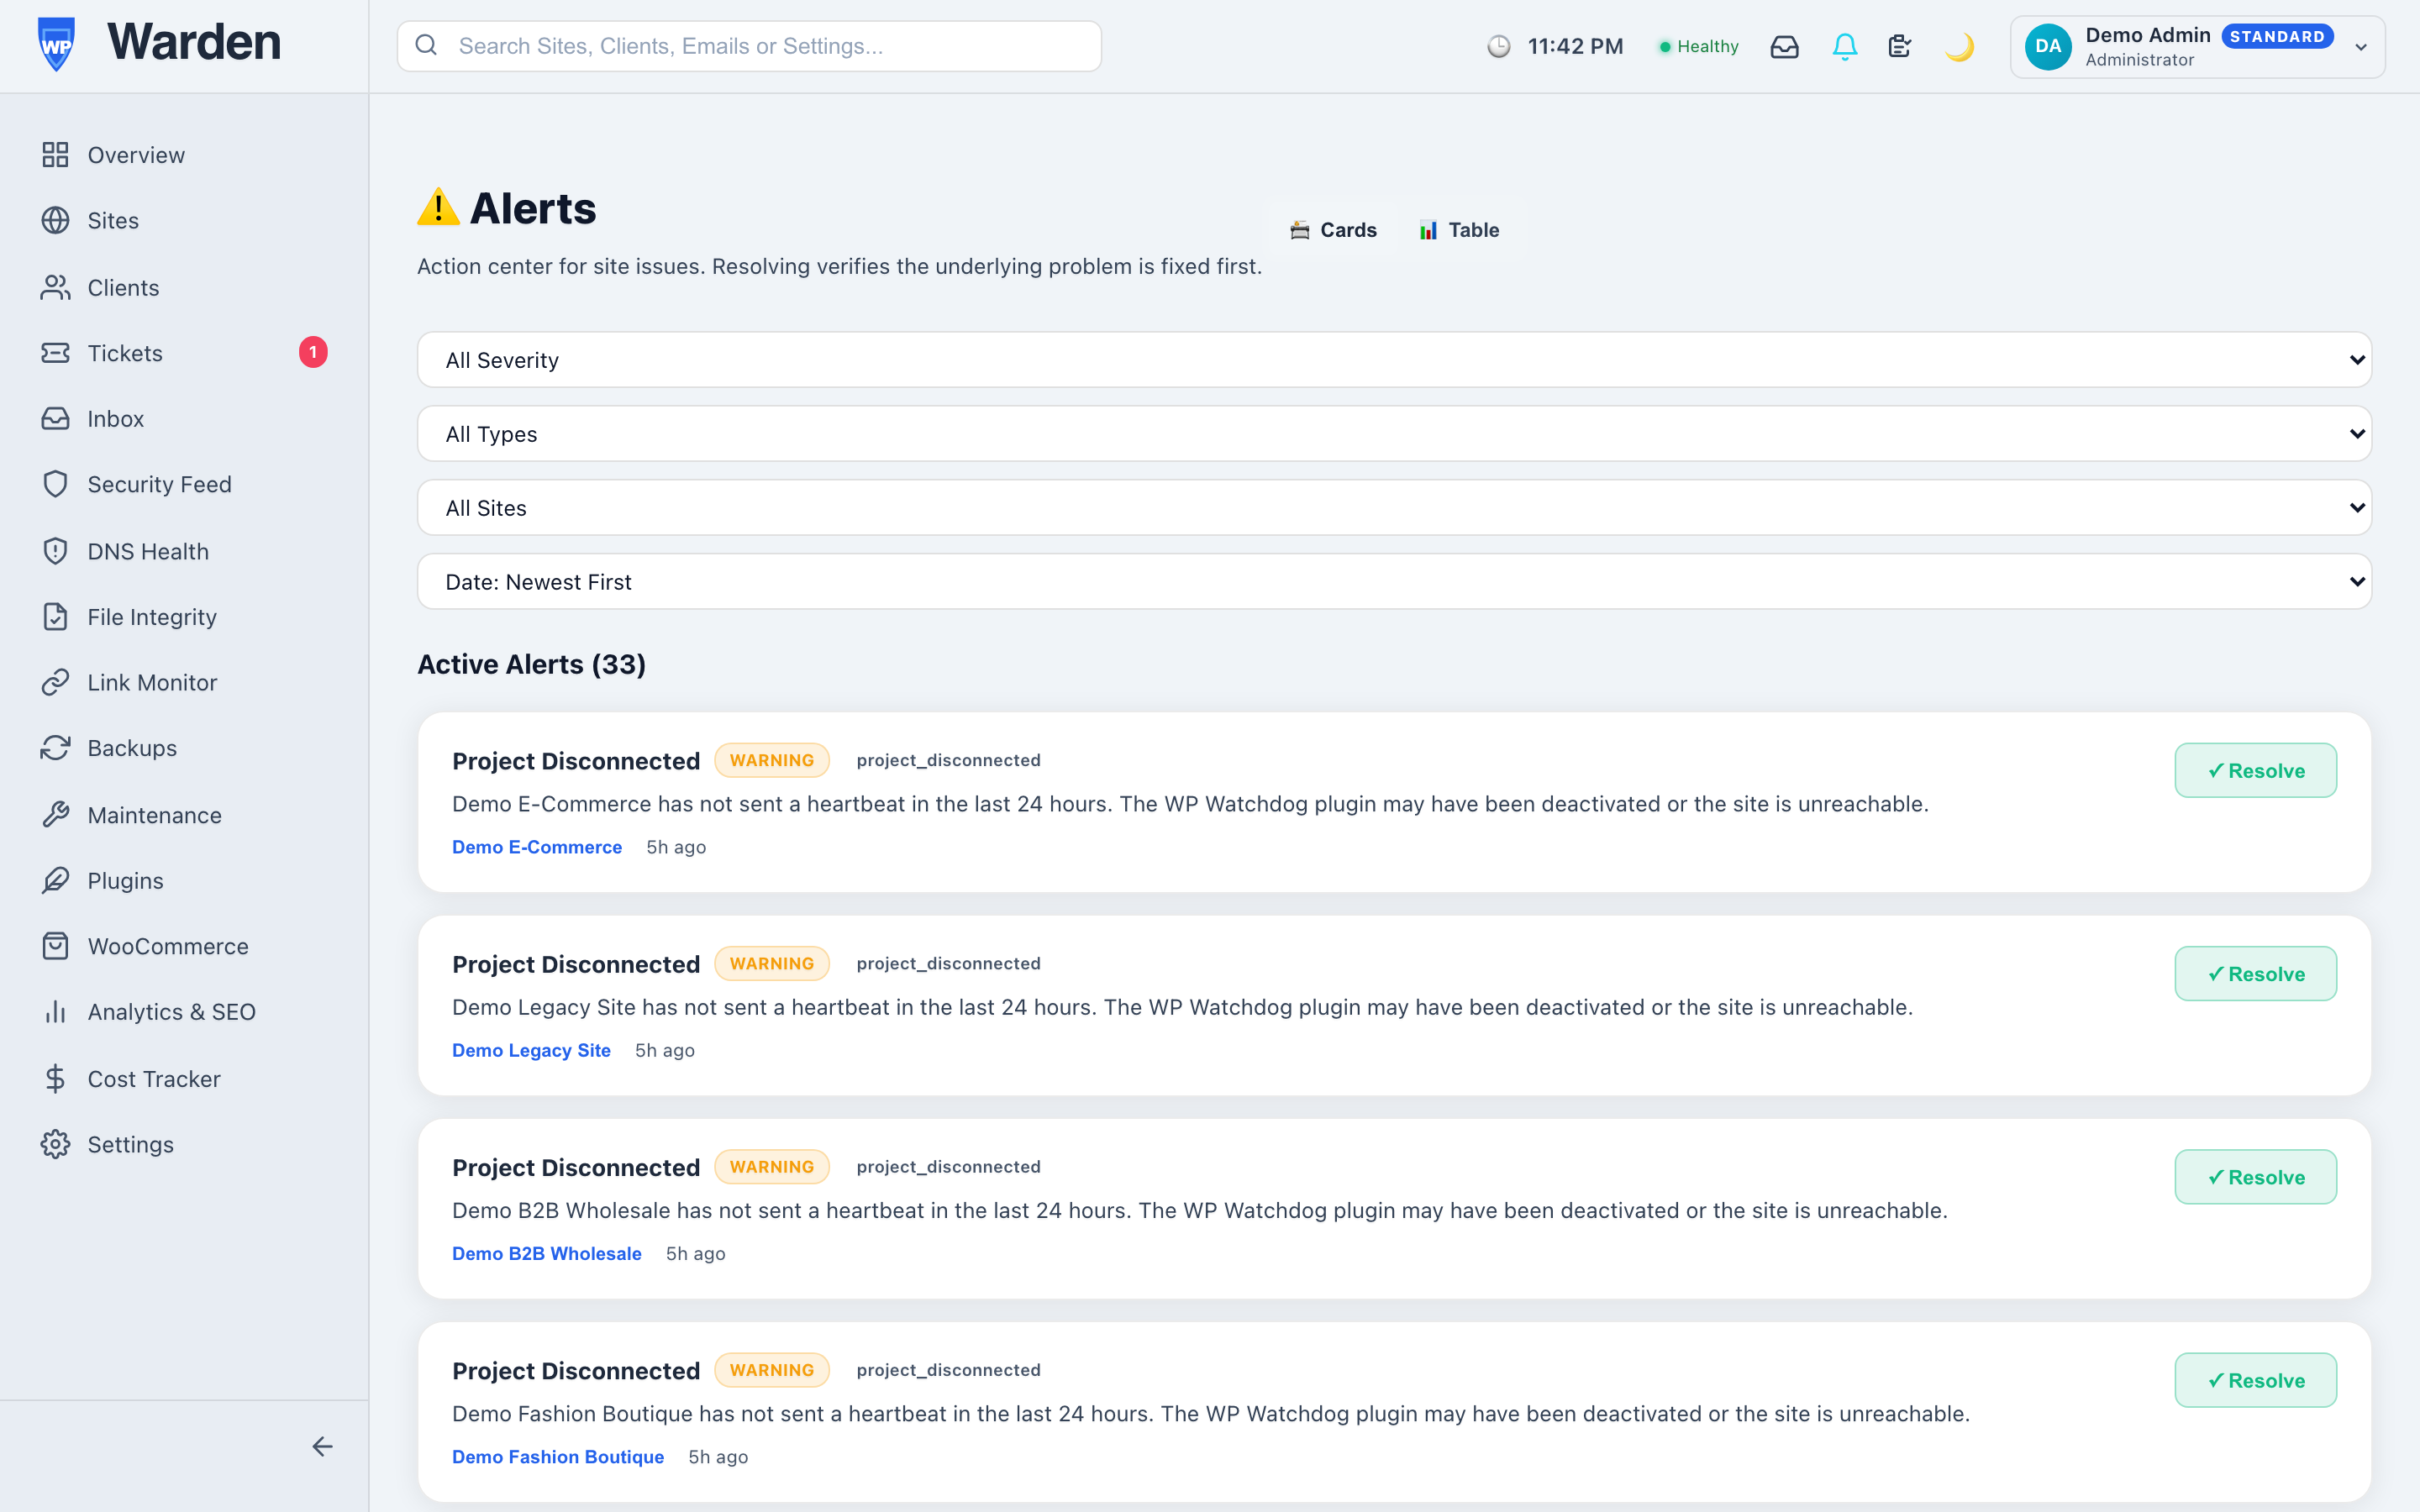
The WP Warden plugin installed on each site sends a regular heartbeat to the backend through the site’s own wp-cron mechanism. If that heartbeat stops arriving, heartbeat monitoring flags it immediately — a genuinely independent signal from HTTP uptime checks, catching a failure category that standard monitoring structurally cannot see, no matter how frequently it runs.
In practice, it’s rarely a dramatic failure — usually one of a handful of quiet, unglamorous causes: a hosting provider changing its outbound request policy without announcing it, a caching layer interfering with cron’s own request cycle, or a plugin conflict that throws a fatal error specifically during the cron process while leaving the rest of the site untouched. None of these show up in a visitor’s browser. All of them show up here.
A site’s hosting provider quietly rolled out a change restricting outbound requests, as part of an unrelated security hardening update on their end. Nothing about the site itself changed, and nothing a visitor could see was affected — the front end kept responding exactly as before. What changed, invisibly, was that scheduled backups stopped completing entirely. Heartbeat monitoring flagged the missed check within a day; without it, the first sign of trouble would have been discovering a three-week gap in backup history at the exact moment a backup was actually needed.
No — a site can respond completely normally to visitors while its cron is entirely broken underneath. This is a structurally different check catching a different, invisible-from-the-outside failure mode.
A hosting-level change to outbound request handling, a fatal PHP error somewhere in the cron chain, or the site’s own wp-cron being disabled somewhere in its configuration.
Start a free 14-day trial — no credit card required.
A site has a rough week — a brief outage, some slow response times — and separately, traffic happens to dip during roughly the same period. Nobody connects the two, because one lives in the monitoring dashboard and the other lives in a completely separate Google Analytics property that nobody thought to check that specific week. The correlation was real. It just never got noticed, because it never had a chance to.
There’s nothing wrong with Google Analytics itself — it’s the standard for a reason. The problem is purely structural: it lives in its own separate login, its own separate mental context, and checking it requires a deliberate decision to go look, rather than being something that’s simply visible alongside everything else you already check daily. A correlation between a technical issue and a traffic dip only gets noticed if someone happens to check both at the same time, which in practice is rare.
WP Warden’s Google Analytics integration uses a standard OAuth flow — connect a site’s GA4 property once, and a daily sync engine pulls real session and page-view data into the same dashboard where you already monitor that site’s health and uptime. There’s no manual API key to copy and paste, and no need to ever open the separate Google Analytics dashboard for a routine check.
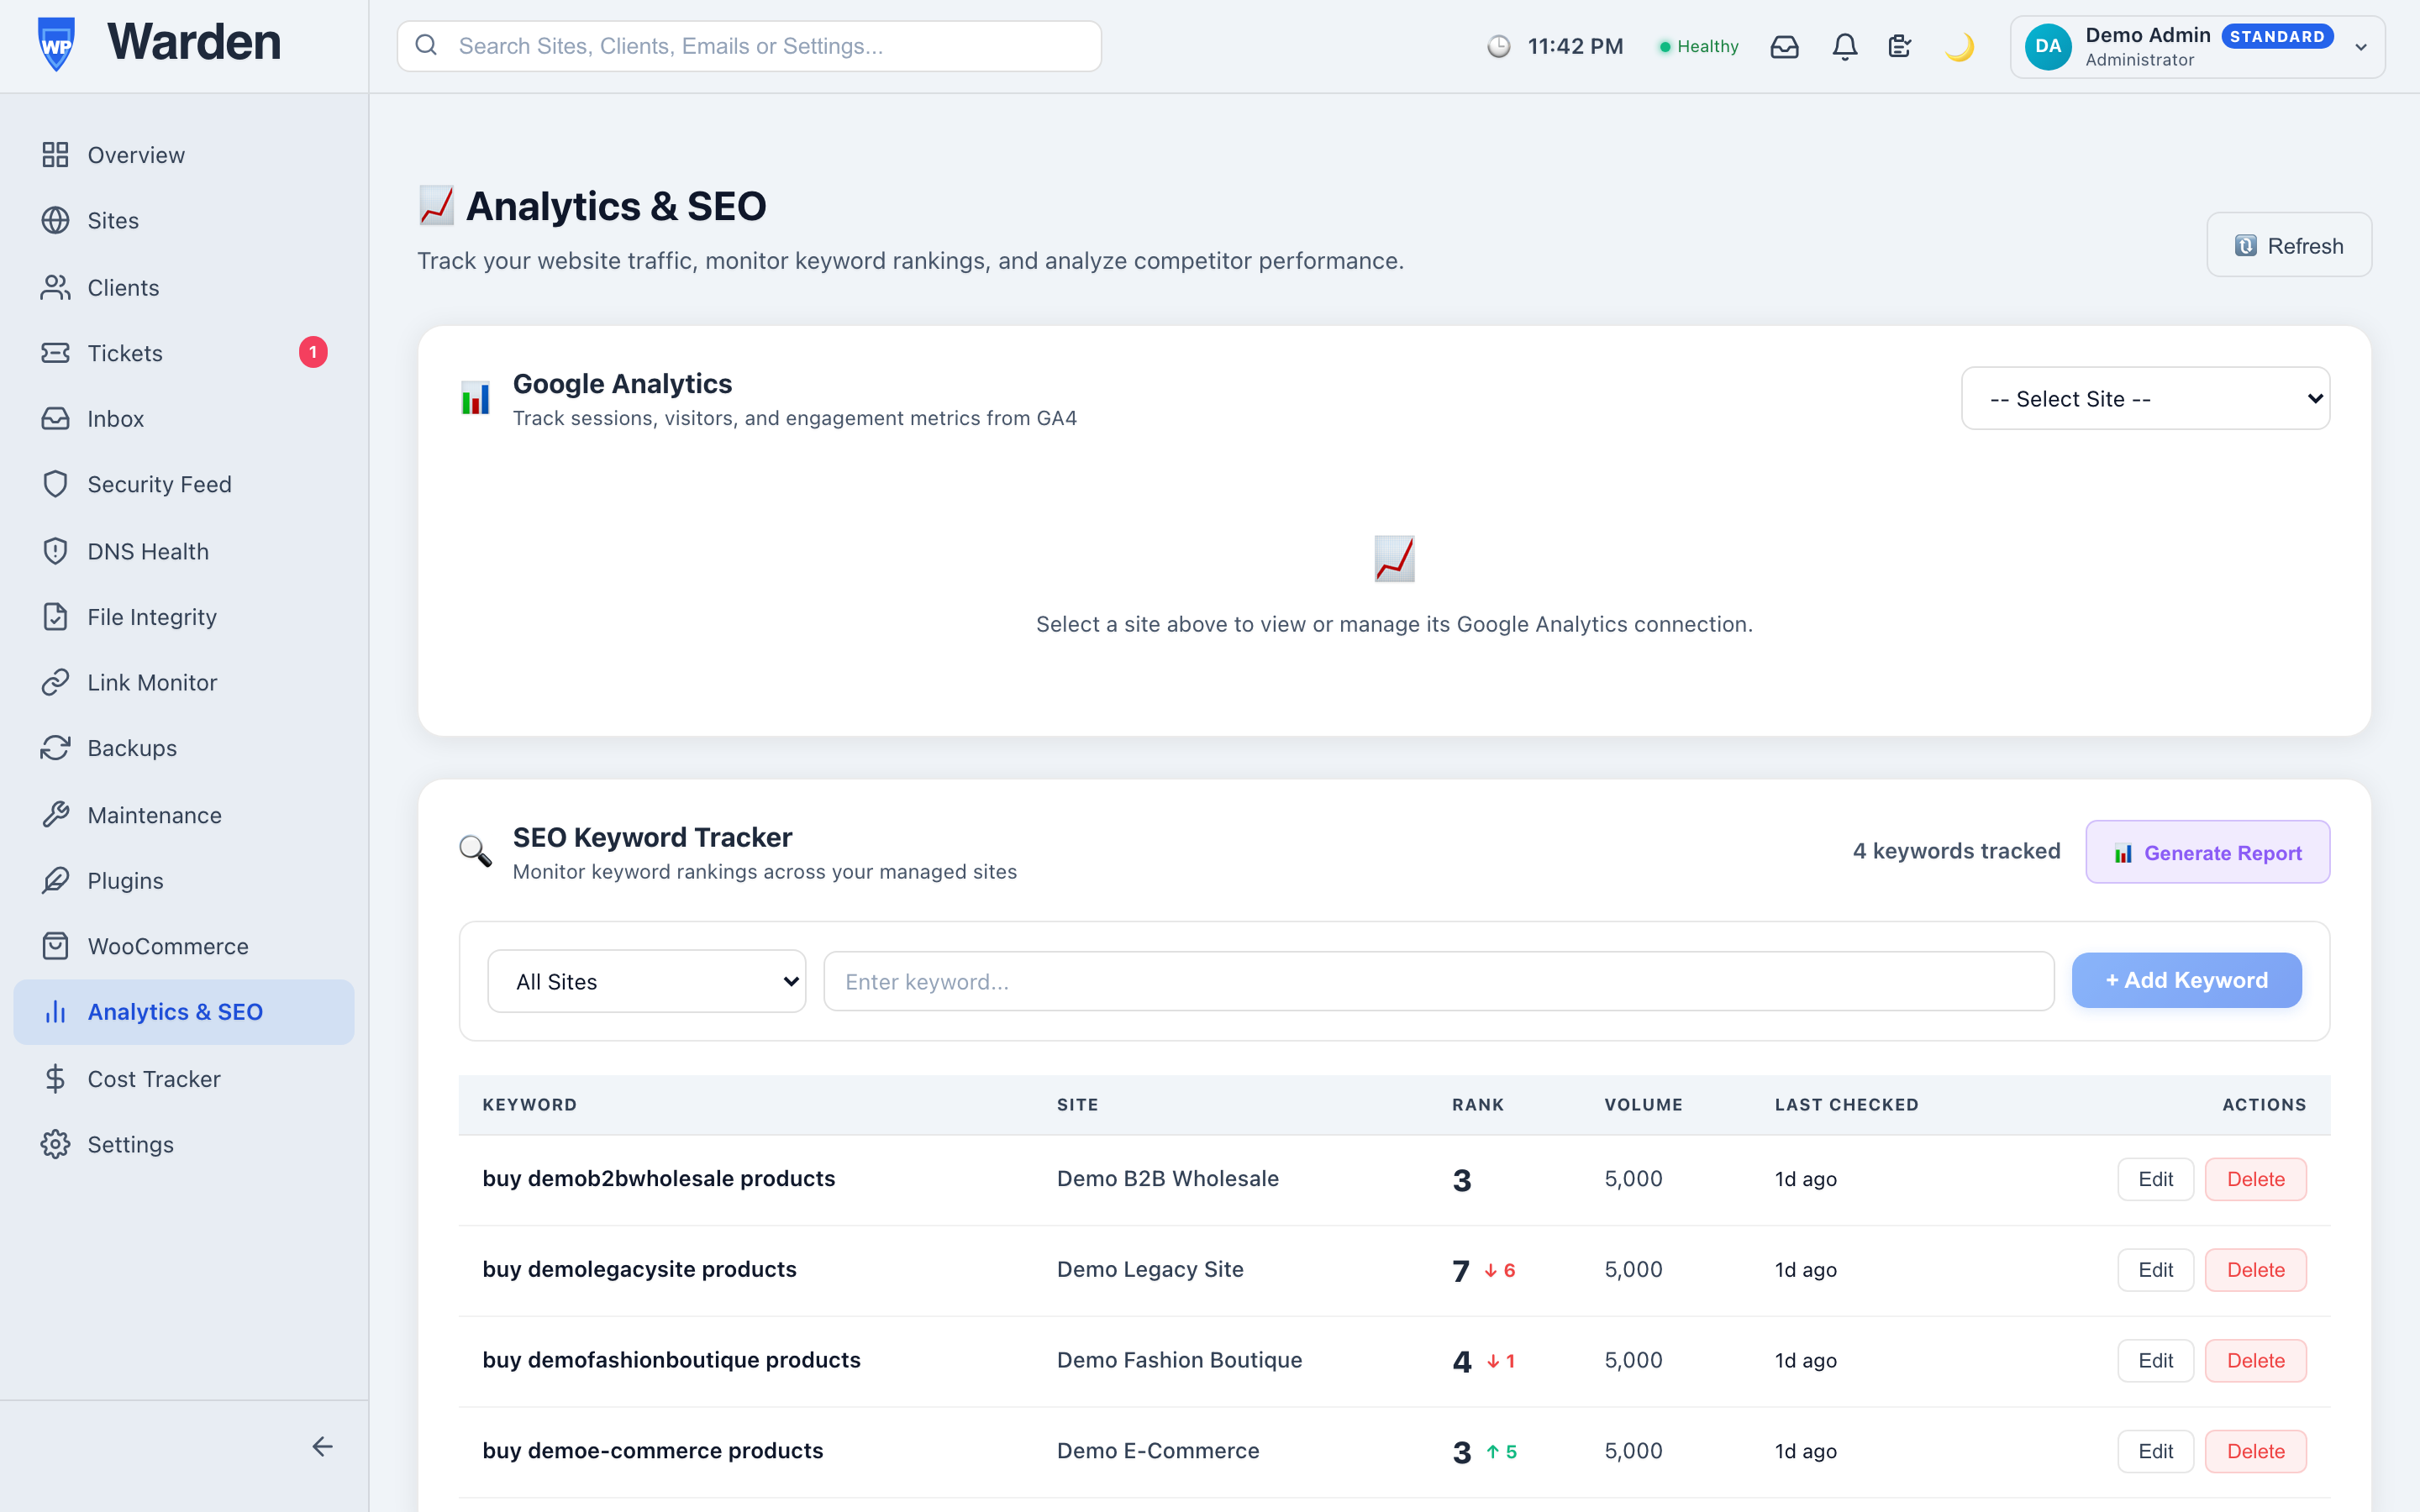
Beyond catching correlations for a single site, this pays off differently at fleet scale: comparing traffic trends across a dozen client sites without opening a dozen separate Analytics properties turns a genuinely tedious task into something that takes a few minutes. It’s especially useful paired with keyword rank tracking on the same sites — together, rank movement and real traffic tell a fuller story than either one does alone.
It’s worth being specific about the actual cost of keeping these two data sources separate, rather than treating it as a minor inconvenience. Without it, a genuine technical incident and a genuine traffic drop can occur in the same week and never get connected in anyone’s mind, because confirming that connection requires actively deciding to open a second tool and compare two timelines by hand — a step busy teams reliably skip. The result isn’t that the data doesn’t exist; it’s that the insight it could have provided quietly never surfaces, and a pattern worth acting on goes unnoticed.
Connecting a site takes a few minutes: authorize access to the relevant GA4 property through the standard Google OAuth screen, and the first sync typically completes within the day. There’s no need to migrate historical data or reconfigure anything on the Google Analytics side — the connection is read-only and additive, meaning your existing GA4 setup, goals, and audiences continue working exactly as they did before, with WP Warden simply given a window into the same data you already collect.
No — it’s a standard OAuth connection flow, the same kind of “Sign in with Google” authorization used across the web generally.
A daily sync engine pulls fresh session and page data automatically, with no manual refresh needed.
Start a free 14-day trial — no credit card required.
Run enough separate WordPress monitoring plugins and you eventually recreate the exact problem monitoring was supposed to solve: five different dashboards, each with its own idea of what counts as an “alert,” none of them talking to each other, and a morning routine that involves checking all five before you can say with any confidence that nothing’s actually wrong. A problem doesn’t care which plugin happened to detect it — your alert system shouldn’t either.
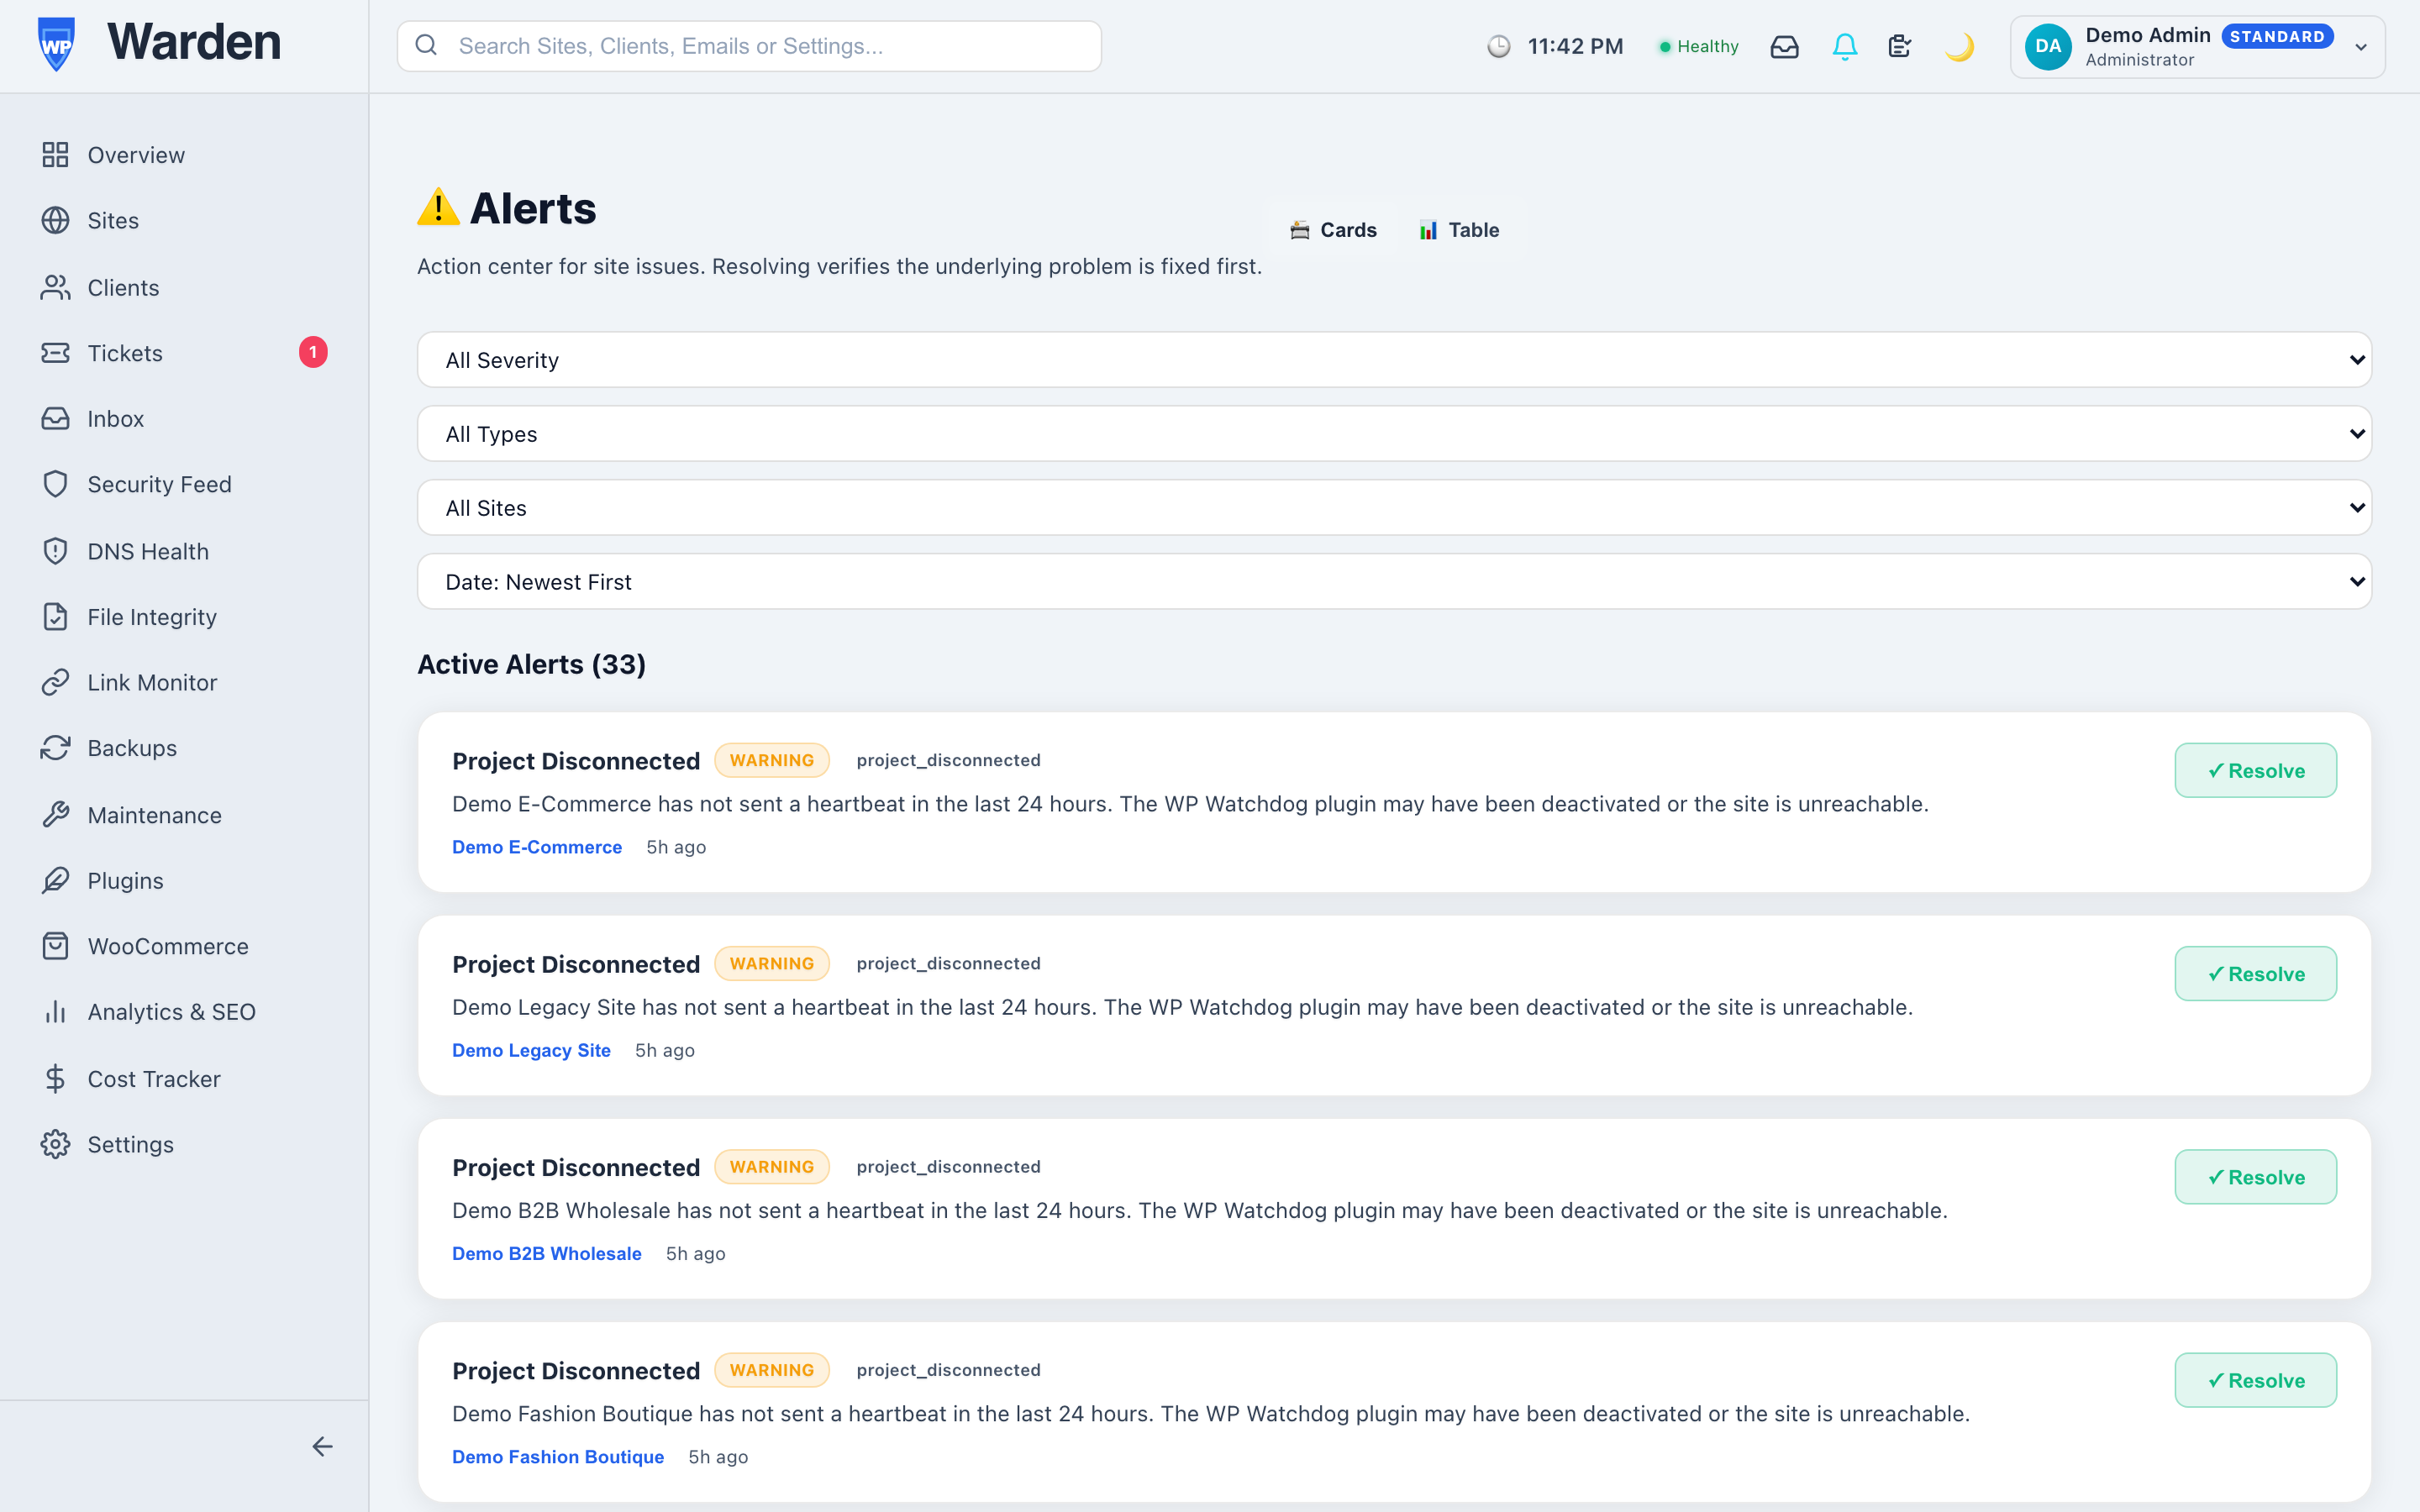
Every monitoring engine in WP Warden — uptime, link monitoring, malware scanning, DNS health, and more — feeds the same central alert system. Every alert carries a type, a severity level, the specific site it belongs to, and a timestamp, and can be snoozed, manually resolved, or left for the auto-resolution engine to close on its own once the underlying condition is actually confirmed gone, not just assumed to be.
Picture a fairly typical setup: a security plugin’s own admin screen for vulnerability warnings, a separate uptime service’s dashboard, a DNS checker somewhere else, and a manual habit of clicking through broken links once a week if there’s time. On a bad week, catching everything means checking four different places, and it’s exactly the week you’re busiest that one of them gets skipped — usually the one that would have mattered.
A single unified list removes that specific failure mode. Every category of problem across every site lands in the same place, so “did I check everything today” has one honest answer instead of four separate ones you have to individually confirm.
Not every open alert needs solving today. A DNS propagation warning during a planned migration, or a link you know is temporarily down while a client’s other vendor fixes something on their end — these are real, known, and temporarily acceptable. The instinct is usually to just close the alert and move on, but that means losing track of it entirely. Snoozing it to a specific date instead keeps it visible on a schedule that actually matches reality, rather than disappearing into a closed-alerts list nobody revisits or nagging every single day for a problem you already know about.
A unified alert list solves fragmentation, but at real scale it can introduce a new problem: volume. That’s what alert notification intelligence is for — correlating related events (the same attacking IP hitting twenty sites in an hour becomes one alert, not twenty separate ones) and batching repetitive notices (like daily update availability) into a single digest window, so what actually reaches your inbox is something worth reading rather than something you’ve trained yourself to skim past. All of it still arrives instantly over the same live connection that updates your dashboard’s alert badge the moment something happens — correlation doesn’t mean waiting longer to find out.
Opening a single alert list at the start of the day and seeing three items — a snoozed DNS warning nobody needs to act on yet, one auto-resolved overnight blip, and one genuinely new issue needing attention — takes under a minute to fully process. The alternative, checking four or five separate tools each with their own version of “is everything okay,” easily takes ten times as long and still risks missing something because no single view ever showed the whole picture at once.
Yes — uptime, links, malware, DNS, and cron heartbeats all report into one unified system rather than separate dashboards you’d otherwise have to check individually.
Some can, automatically, once a later check genuinely confirms the original condition is gone. Anything requiring real human judgment, like a malware finding, always waits for a person to review it.
Start a free 14-day trial — no credit card required.
One plugin file gets corrupted during a bad update, or a client accidentally overwrites their own homepage template — and the fix you actually need is one file back to how it was yesterday, not a full-site rollback that also undoes every other legitimate change made since then. WordPress single file restore exists for exactly that gap between “nothing’s wrong” and “roll back everything.”
A full-site restore is a blunt instrument by design — it puts everything back to exactly how it was at one point in time, which is correct when the whole site needs to go back, and badly wrong when only one thing broke. Roll back a whole site to fix one corrupted plugin file, and you also undo every legitimate post, comment, and setting change made since that backup — real work, discarded to fix a problem that only ever touched one file.
WP Warden’s Time Machine opens up one of your site’s existing backup archives and lets you browse its contents directly — individual files, specific plugins or themes, media, or even individual database tables — and pull back just the piece you actually need. It’s worth being precise about what this is: not a separate, continuously-running version history tracking every file change as it happens, but a way to reach into a backup you already have and take exactly one thing out of it, restored on its own, without touching anything else on the live site.
Anything that was part of the original backup archive is fair game: a single plugin’s files if an update went wrong, a theme template a client accidentally broke, a media file that got deleted, or one specific database table if a plugin corrupted its own settings without touching the rest of the site’s content. Selecting just what you need and confirming runs synchronously — you get a result back directly, not a queued job you have to wait on and check later.
Two things are worth knowing before you rely on this in a real emergency. First, how far back you can reach is exactly as far as your backup retention goes — this isn’t an independent history separate from your regular backups, it’s a way to open the ones you already have. Second, it currently works against a backup’s local copy on the site itself; if the specific backup you need only exists in your off-site cloud storage with no local copy retained, that particular snapshot isn’t browsable this way. Practically, this means your most recent backups — the ones most likely to still have a local copy — are the ones you can count on for this kind of surgical restore.
Not directly — it currently requires a local copy of the specific backup you want to browse. If that snapshot is cloud-only, a full restore of that backup is the available path instead of a single-file pull from it.
Yes — a whole plugin or theme’s file set is one of the restorable units, alongside individual files, media, and database tables, so you’re not limited to restoring one file at a time if the whole plugin needs to go back.
No — version control tracks every change continuously with its own independent history. Time Machine works from your existing backup snapshots, so its granularity in time is however often those backups run, not a change-by-change history in between them.
Start a free 14-day trial and fix the one file that broke without touching everything else.
Fifty plugins across twenty sites, all needing the same update, is exactly the kind of task that tempts you to just click through it as fast as possible. Bulk WordPress updates exist to make that fast path also the safe one — but only if the batching itself is built to isolate failure and avoid overwhelming any single site along the way.
The single biggest fear with batch operations is one bad item taking down the whole run — a site that’s paused, offline, or simply doesn’t have the plugin installed halting an update meant for nineteen other sites. WP Warden’s bulk updates process each site independently: an invalid or failed entry gets recorded and reported back, and the rest of the batch keeps going regardless. A batch of twenty succeeding on nineteen and clearly flagging the twentieth is a completely different, much safer outcome than an all-or-nothing operation that silently fails everywhere the moment one site has a problem.
It’s tempting to assume “bulk” means every update runs the instant you click confirm. In practice, each site’s connected plugin picks up commands on its own heartbeat cycle, and heavy operations — plugin, theme, and core updates specifically — are deliberately capped at a handful per cycle rather than dispatched without limit. That throttling exists because of a real, previously-encountered failure: sending too many heavy update commands to a single site in one request can time out the host itself. Capping the load per cycle means a site with a long list of pending updates works through them steadily over a few cycles instead of risking a timeout trying to do everything simultaneously. The practical effect for you: a large batch on a single site finishes over several minutes rather than instantly, and that’s the system protecting the site, not a bug.
Every plugin, theme, or core update queued this way automatically triggers before-and-after visual regression testing — a screenshot right before the update and another right after, compared automatically. This isn’t a separate step you have to remember to set up for a bulk run specifically; it’s the same mechanism that runs for a single manual update, which means a batch of fifty updates gets fifty individual safety checks, not one blanket assumption that everything went fine.
Before an update actually runs, a scoped snapshot of just that plugin, theme, or core file set is taken — not a full site backup, but enough to undo that specific change if it turns out to be the problem. This matters for bulk operations specifically: if a visual regression alert flags one site out of twenty after a batch, you can undo that one update on that one site without touching the other nineteen or reaching for a full-site restore for what might be a single bad plugin version.
Batching everything is usually right, but not always. A plugin that just shipped a major version bump — a jump from 3.x to 4.x, not a routine point release — is worth holding out of the very first batch and updating on one or two lower-stakes sites first. Major versions are where breaking changes actually happen; routine point releases rarely warrant that caution. Once you’ve confirmed it behaves normally somewhere low-risk, rolling it into the rest of the fleet’s batch is reasonable again.
Picture twenty-five client sites with a shared plugin flagged for a routine security update. Queuing bulk WordPress updates across all twenty-five kicks off independently on each site’s own schedule: most sites have only that one update pending and finish within a single heartbeat cycle. Two sites happen to have a backlog of several other pending updates too, so those specifically take a few extra cycles to work through everything queued, not just the one you just added. One site is paused for an unrelated reason and gets flagged as failed rather than silently attempted. By the time the run settles, twenty-four sites show a completed update with a clean visual regression check, one shows a specific, actionable reason it didn’t happen — and none of that required watching any of it happen in real time.
Yes — a site that’s paused or offline is excluded from the batch and reported as a failed entry rather than silently skipped or retried indefinitely, so you always know exactly which sites in a batch didn’t actually get updated.
It depends on how many updates each individual site has pending, since heavy commands are throttled per site per cycle rather than fired all at once. A fleet where most sites have one or two pending updates finishes quickly; a fleet with a long backlog on a few sites takes those specific sites longer, working through their queue over several cycles.
Not as a first line of defense — the automatic visual regression check surfaces anything that visibly broke. It’s still worth spot-checking a genuinely critical site (a client’s primary revenue page) directly after a major update, the same way you would with a single manual update.
Start a free 14-day trial and update your whole fleet without babysitting every single site.
Every agency has a backup plugin installed somewhere. Far fewer have actually tested a restore, checked how far back their history really goes, or thought about what happens when the backup itself lives on the same host as the site it’s protecting. A real WordPress backup strategy is less about which tool you use and more about frequency, retention, and storage location actually matching what you’d need in a real emergency.
The standard reference point for backup strategy is the 3-2-1 rule: three copies of your data, on two different types of storage, with at least one copy off-site. For a WordPress agency, “off-site” specifically means not stored on the same server as the live site — a host-level failure, a compromised account, or a billing lapse can otherwise take out your site and its backup in the same incident. WP Warden’s backup system supports this directly: backups can go to WPWarden’s own cloud storage, Google Drive, OneDrive, or AWS S3, so the off-site copy is a configuration choice, not a manual export you have to remember to do.
Frequency should follow how much you’d lose if you rolled back to the last backup, not a single fleet-wide default. A brochure site updated twice a year is fine on daily or even weekly backups — nothing meaningful changes between runs. A WooCommerce store taking orders every few minutes is a different calculation entirely: rolling back six hours means losing six hours of real orders. That site earns the tighter, more resource-intensive schedule; the brochure site doesn’t need it and shouldn’t carry the extra storage cost of it.
Worth knowing if you’re setting up an hourly schedule specifically: hourly backups require an off-site destination (Google Drive or OneDrive) with local storage disabled, rather than being available on every storage option — a deliberate constraint, since keeping hourly snapshots piling up on local storage indefinitely isn’t realistic at that cadence.
“Full backup” is a term worth double-checking rather than assuming. By default, a full backup includes the database and WordPress core along with your files — but wp-config.php is excluded by default, since it holds database credentials and secret keys that some agencies prefer to manage and rotate separately rather than have duplicated across every backup archive. If your recovery plan assumes wp-config.php is automatically included, that’s worth confirming rather than discovering during an actual restore. Custom include/exclude paths are available if a site has specific folders that don’t need backing up at all — a large, regenerable cache directory, for instance.
Retention settings usually get treated as a single number — “keep backups for 30 days” — but the real trade-off is between how far back you can go and how much storage that costs at a given frequency. Keeping 90 days of hourly backups would mean well over 2,000 archives per site; that’s not a realistic default for anyone. In practice, your fastest-cadence backups (hourly, daily) cover the recent window where a quick rollback actually matters, while your less frequent backups (weekly, monthly) are what let you reach further back in time without the storage bill exploding. Think of it as two different jobs: daily backups are your “something broke this morning” safety net; weekly or monthly backups are your “we didn’t notice this problem for three weeks” safety net.
Restoring is one action on your end — pick the backup, confirm — but it’s worth understanding what happens after that click. The restore is queued as a command the site’s own connected plugin picks up and executes, not something that completes synchronously the instant you click the button, and only one restore can run on a given site at a time. In practice this means a restore typically starts within a few minutes, not seconds — plan around “in progress shortly,” not instantaneous, particularly if you’re doing this live on a call with a client watching.
A backup you’ve never restored from is a hypothesis, not a safety net. It’s worth actually running a test restore — to a staging copy, not the live site — at least once per quarter for your highest-priority clients, confirming the site comes back up cleanly and nothing critical (a payment gateway config, a custom upload path) was silently missed. This is the single most skipped step in most agencies’ backup routines, and the only one that actually proves the rest of the strategy works.
A WordPress backup strategy that actually works is written down somewhere, not just configured once and forgotten. For each site or tier of sites, it’s worth being explicit about four things: the frequency (how often a new backup runs), the retention window (how far back you can actually reach), the storage destination (where the off-site copy lives), and who’s responsible for confirming it’s still running. That last one matters more than it sounds — a backup schedule silently failing for two weeks because a storage connection expired is only caught by someone actually checking, not by the schedule itself.
A simple, tiered version of this covers most agencies well: a default backup strategy for standard sites (daily, off-site, two weeks of retention), and a tighter one reserved for high-value or transactional sites (more frequent, longer retention, tested restores on a fixed schedule). Writing this down once, and applying it consistently as new sites come on board, is what turns backups from “something we have” into an actual strategy.
For the majority of content-driven and brochure sites, yes — daily backups are the widely accepted minimum for any actively maintained site. Sites with frequent transactions or user-generated content (ecommerce, membership sites) genuinely benefit from a tighter interval, since the gap between backups is exactly how much real activity you’d lose in a rollback.
Only if your retention window reaches back further than the infection has been present — a common reason to keep at least a couple of weeks of history rather than the bare minimum, since malware that’s been quietly present for ten days will already be baked into yesterday’s backup.
Not exclusively. A local copy is convenient for fast restores, but an off-site copy is what actually protects you if the host itself has a problem — account compromise, billing failure, hardware failure. Using both isn’t redundant, it’s the point.
Start a free 14-day trial and put a real backup strategy behind every site in your fleet.