How to monitor WooCommerce stores
CommerceGet a bird’s-eye view of all your clients’ WooCommerce stores. Track revenue, daily orders, failed payments, and low stock items without logging into WordPress.
-
Go to WooCommerce in the dashboardClick WooCommerce in the left sidebar.
-
Review the KPI summaryThe top cards show fleet-wide totals: total orders in 24h, total revenue, failed payments, and out-of-stock items.
-
Check individual storesEach store appears as a row in the table, showing 24-hour orders and revenue, failed and pending payments, stock alerts, and SSL/gateway status at a glance. Click a row to expand it into a detailed panel with a 7-day order volume chart and any active alerts (e.g. gateway disabled, SSL issues).
-
View recent ordersWith a store’s row expanded, click the Recent Orders tab to see a table listing the latest orders, their status, amount, and customer.
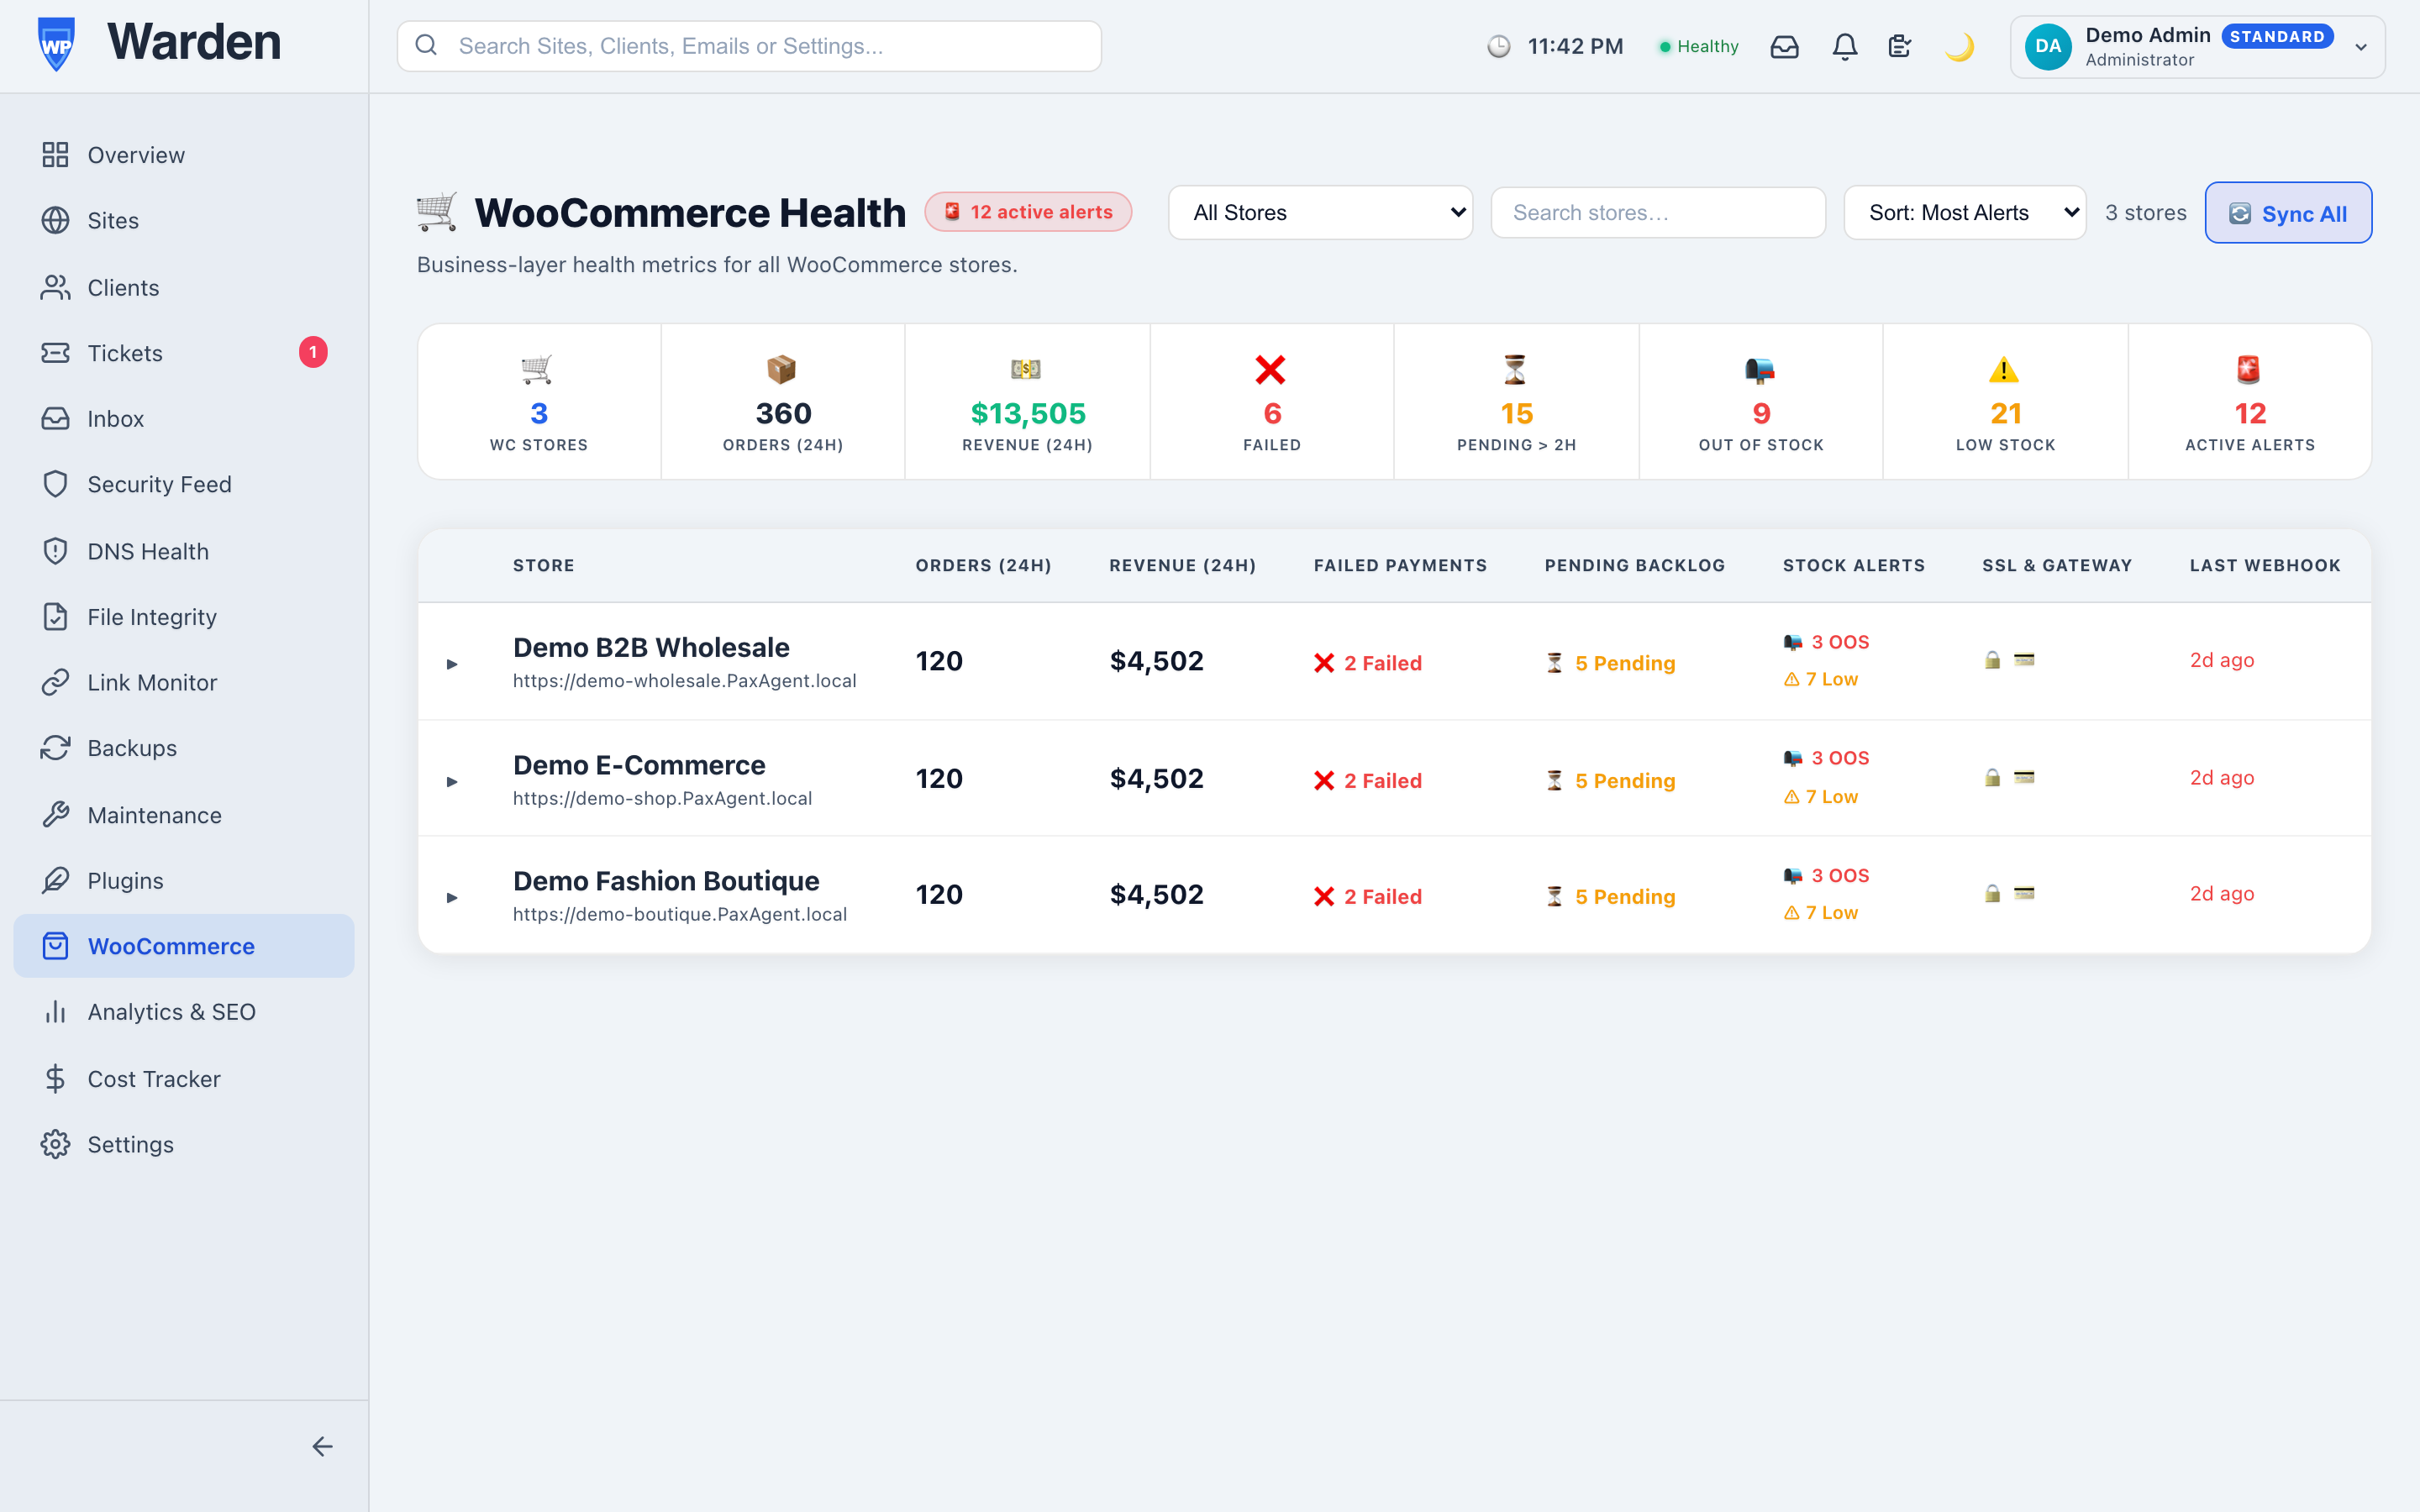 Screenshot: WooCommerce Dashboard
The dashboard showing KPI cards, store list, and recent-order trend mini-charts.
To enable WooCommerce monitoring, the site must have the WP Warden Watchdog plugin installed and WooCommerce REST API keys configured with read access.
Generate those keys on the store itself, not in WP Warden: in that site’s wp-admin, go to WooCommerce → Settings → Advanced → REST API, click “Add key,” set permissions to Read, then copy the Consumer Key and Consumer Secret into WP Warden. See WooCommerce’s own guide: WooCommerce — “WooCommerce REST API”. The Consumer Secret is shown only once at creation — copy it immediately.
How to track SEO and Traffic Analytics
GrowthCentralize your SEO rankings, domain authority, and traffic metrics to prove your value to clients inside your automated reports.
-
Go to AnalyticsClick Analytics in the left sidebar.
-
Connect integrationsConnect Google Analytics 4 for each site via a one-time OAuth sign-in directly on the Analytics page — this connection is required to pull in traffic metrics; WP Warden does not track site traffic on its own.
-
Review traffic trendsThe Analytics page displays visitor counts, sessions, and bounce rates for each site over the selected date range.
-
Include in Client ReportsTraffic data is automatically included in the “Audience & Traffic” and “SEO Rankings” sections of the generated PDF reports and client portal.
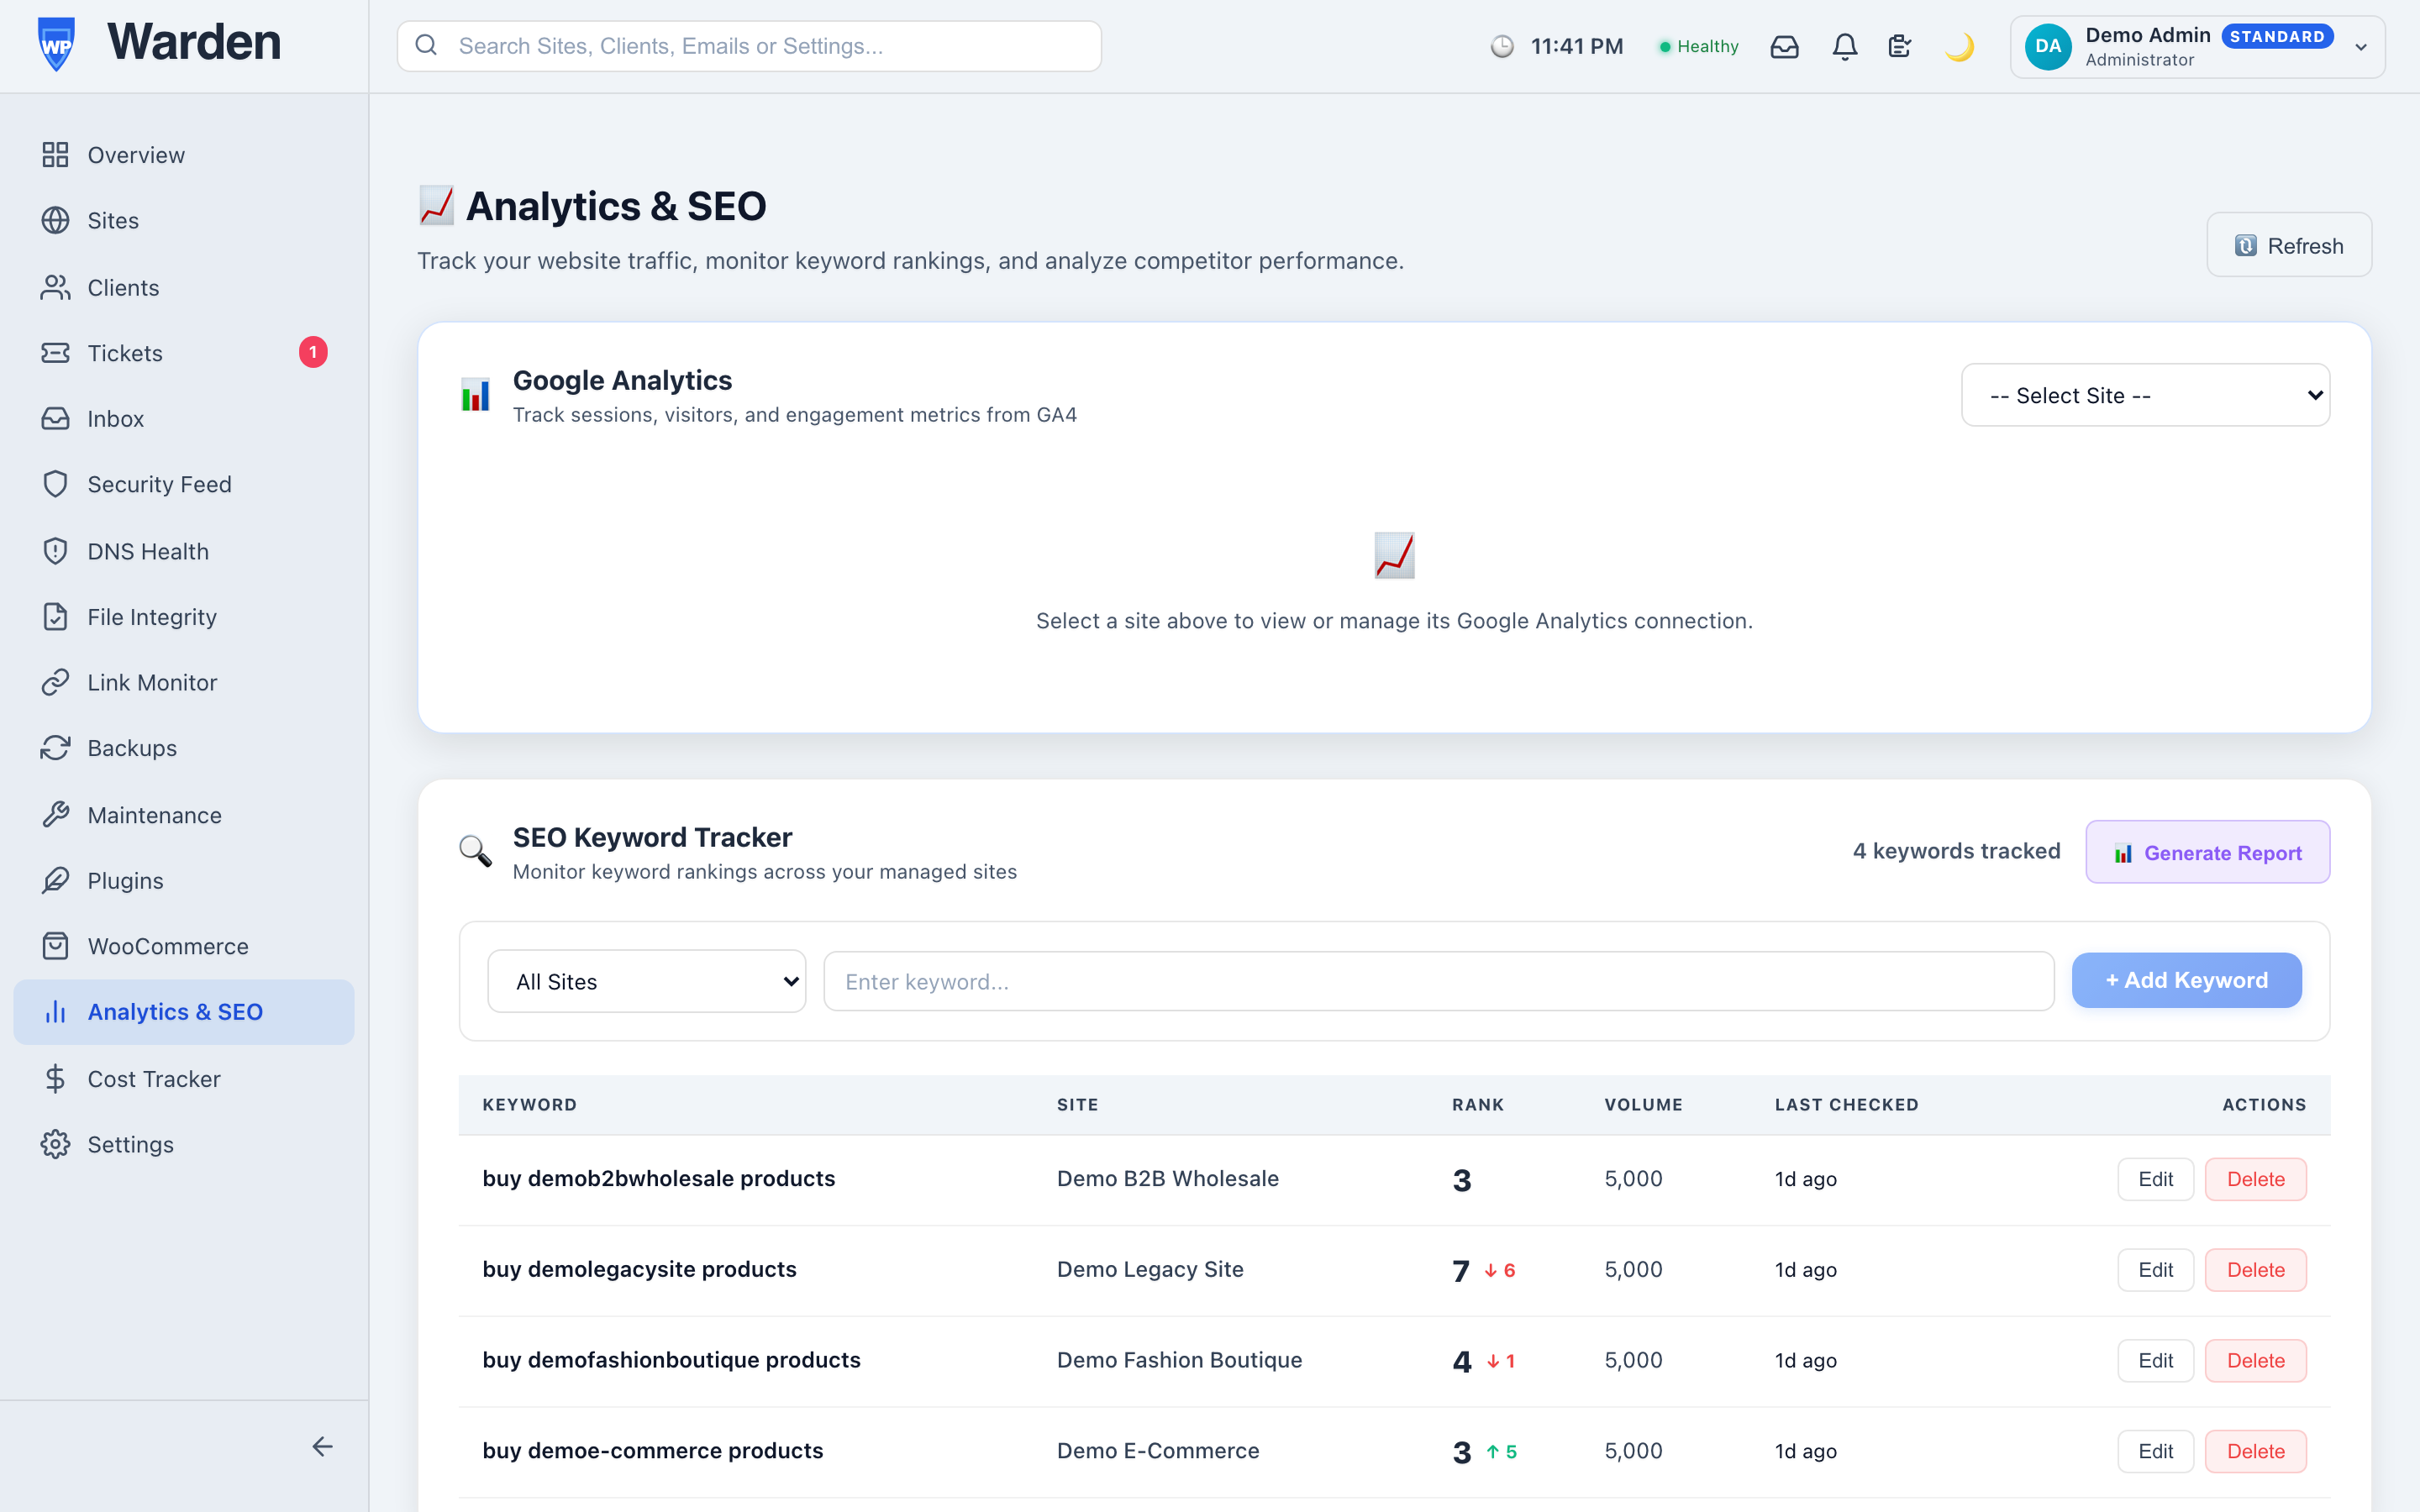 Screenshot: Analytics Dashboard
The Analytics page showing line charts for traffic and a table of top-performing pages.
How to track agency costs and expenses
FinanceTrack your hosting, domain, and premium plugin expenses, break spending down by category, site, and client, and generate reports for your own records.
-
Go to CostsClick Costs in the sidebar to view your infrastructure spending.
-
Add an expenseClick “+ Add Expense” to log a domain, hosting plan, or premium plugin license. Set the amount, whether it’s recurring or one-time, the billing frequency (monthly/yearly/quarterly), and category.
-
Link expenses to sites and clientsOptionally assign an expense to a specific site and/or client so you can filter and report on spending by either.
-
Review spend trends and breakdownThe Costs page shows your monthly spend trend over the last 12 months and a breakdown by category, plus summary cards for this month’s total, this year’s total, average cost per site, and high-cost sites.
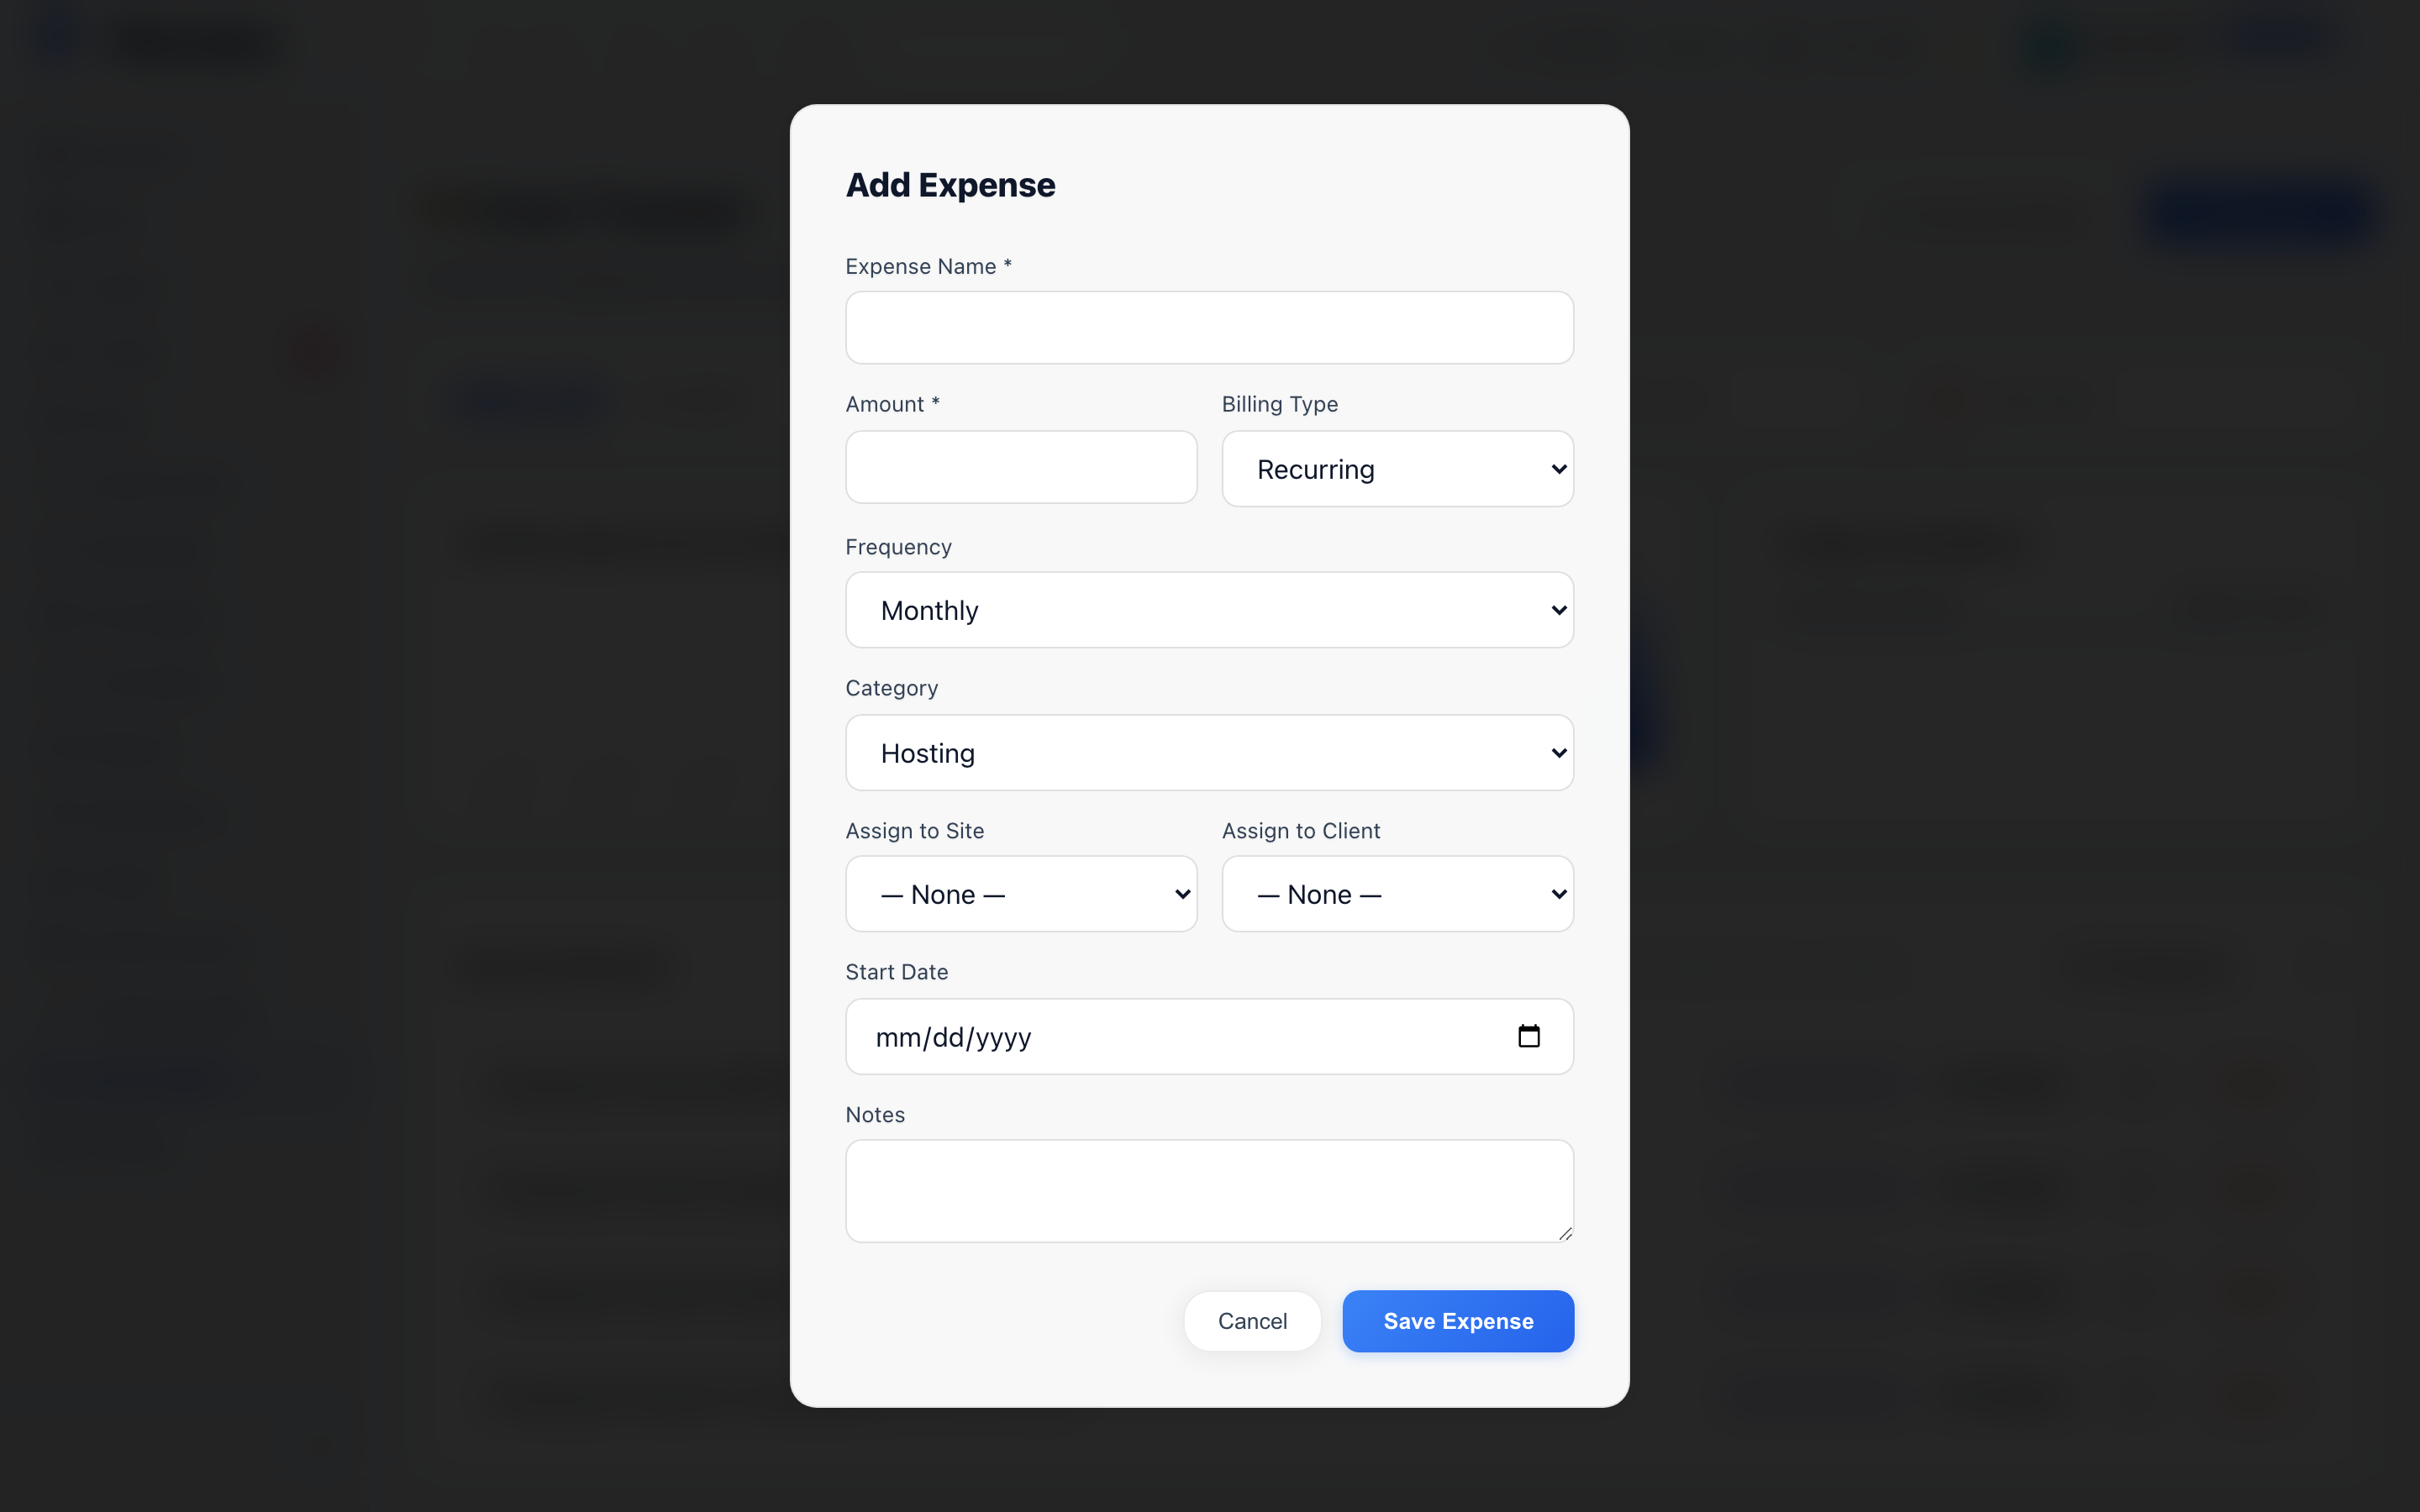 Screenshot: Costs & Renewals Page
A table of expenses with amount, frequency, category, and assigned site/client, alongside the monthly spend chart and category breakdown.
Use the Generate Report button to export a filtered expense report (by date range, client, site, or category) that you can share with stakeholders or keep for your own records.