How to run a vulnerability scan
SecurityWP Warden checks every plugin, theme, and WordPress core version across all your sites against known CVE databases. Scans run automatically on a schedule, but you can also trigger one on demand.
-
Automatic scans happen daily
WP Warden runs a full fleet vulnerability scan every day at 4:00 AM using WPVulnerability.net. If Patchstack is configured instead, that daily scan is replaced by a scheduled Patchstack sync every 6 hours with virtual-patch status. -
To run a manual scan
Go to Vulnerabilities in the sidebar. Click Run Global Security Audit at the top of the page. WP Warden immediately scans all connected sites and refreshes the results. -
Review the vulnerability list
Results show: affected plugin/theme name, CVE ID (if available), CVSS severity score (0–10), severity badge (Critical / High / Medium / Low), affected version range, and the fixed-in version. -
Check for virtual patches (Patchstack users)
Vulnerabilities with an active Patchstack virtual patch show a Warning severity instead of Critical/High, and display the note: “Virtual patch active via Patchstack. Update still recommended.” -
Remediate vulnerabilities
For each vulnerability, go to the Plugin Inventory and update or deactivate the affected plugin. See How to update a plugin.
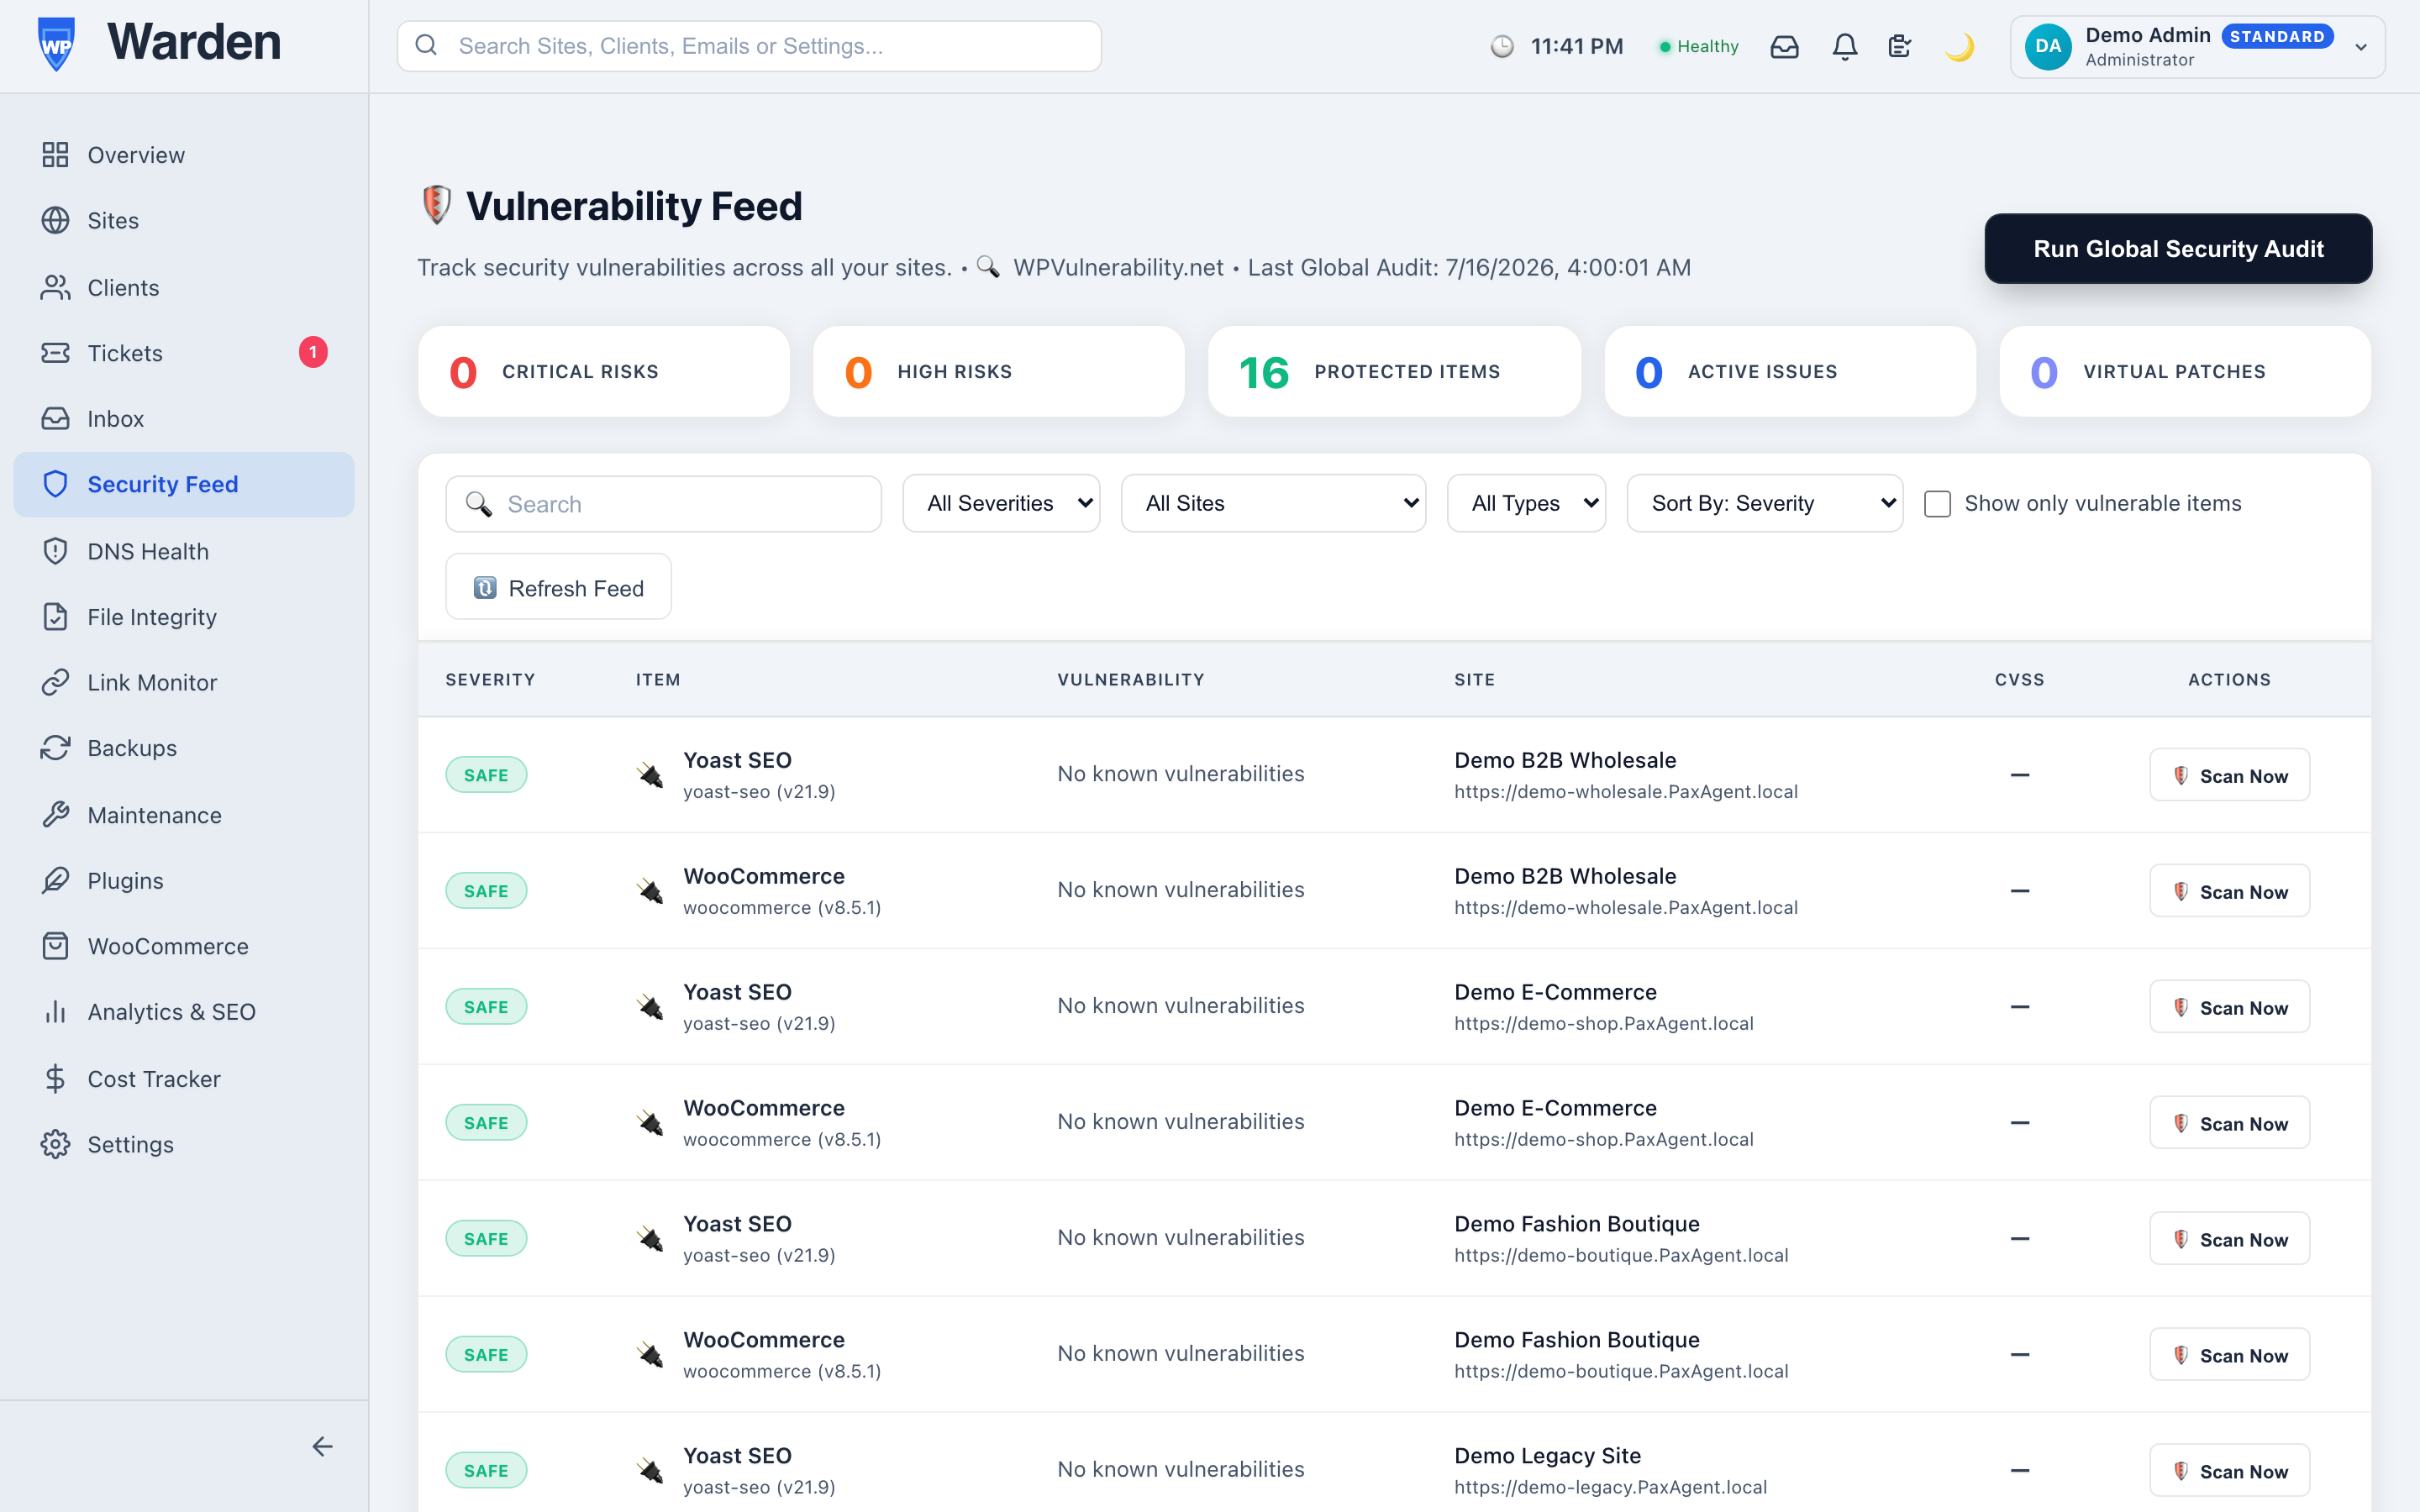 Screenshot: Vulnerabilities page
The vulnerability feed showing severity badges, CVE IDs, affected plugins, and the fixed-in version column.
Every client report includes a Security Status section and a Security Hardening Checklist (user registration, file editor, XML-RPC, DB prefix, directory browsing). Enable these sections when generating reports for security-conscious clients.
Vulnerability scanning runs on the free
WPVulnerability.net feed for every account — no third-party service or extra cost involved. Patchstack
is a separate, paid third-party service that our architecture can optionally sync with instead (virtual
patch status, wired up at the platform level via an API key, not a self-service Settings toggle), but
it isn’t part of our current offering. If you’re self-hosting WP Warden and want to use your own
Patchstack account regardless, see Patchstack’s own docs on
where
to find your API key and set it as the PATCHSTACK_API_KEY environment variable.
How to configure and manage alerts
MonitoringWP Warden generates alerts automatically for downtime, cron failures, broken links, vulnerabilities, and more. Here’s how to view, filter, resolve, and snooze them.
-
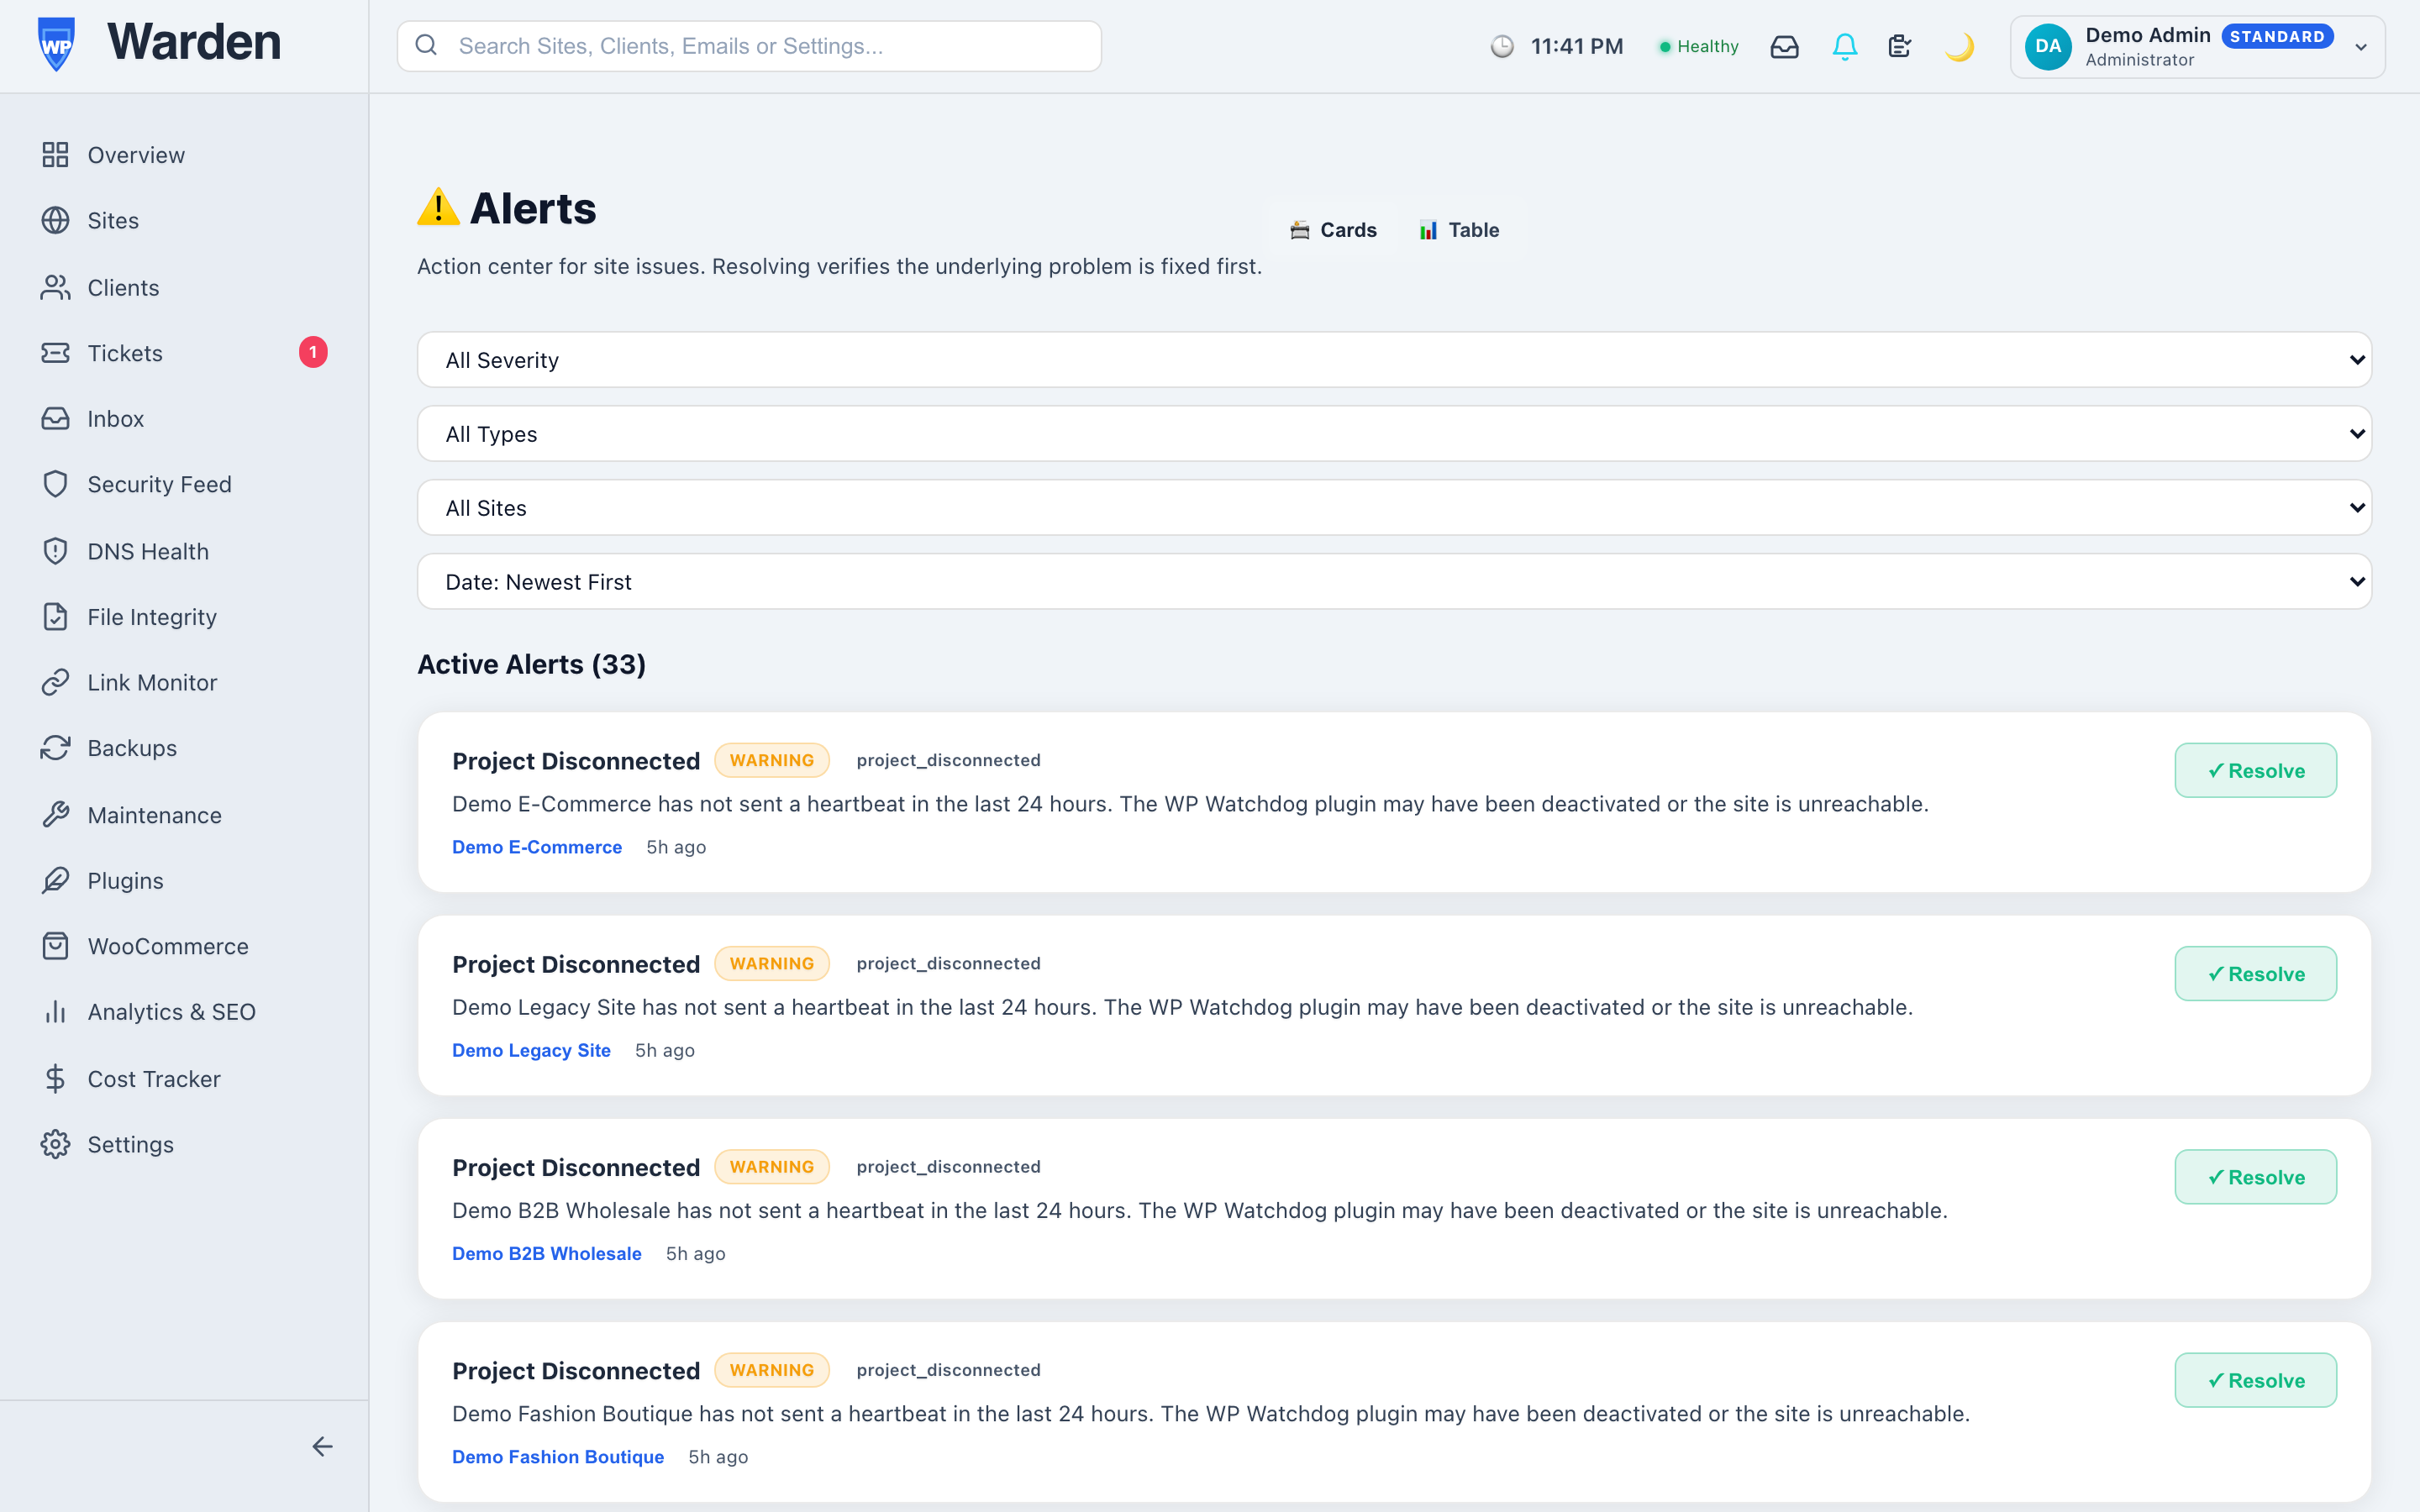
View all alerts
Click Alerts in the sidebar. The alerts page lists all active alerts across your entire fleet. -
Filter by severity or type
Use the filter dropdowns to narrow by: Severity (Critical / High / Warning / Info) or Type (downtime, cron_failure, vulnerability, zombie_plugin, broken_link, visual_regression, etc.). As a rough triage order: Critical (e.g. the site is unreachable, or a vulnerability with a high CVSS score) needs action now. High/Warning (lower-severity vulnerabilities, a broken link, a stale cron) can usually be scheduled rather than dropped everything for. Info is for awareness only. When several alerts are open at once, work down from Critical. -
Resolve an alert
Click the Resolve button on an alert row. For certain alert types (cron failures, broken links, zombie plugins, vulnerabilities), WP Warden performs a verify-before-resolve check. If the underlying issue is still present, a “Still Persisting” modal explains why. You can choose to Force Resolve to override. -
Snooze an alert
Click the clock icon to snooze an alert until a future date/time. Snoozed alerts are suppressed from notifications and the dashboard badge until the snooze period expires. -
Configure which alerts trigger emails
Go to Settings → Notifications tab to control which alert types send email notifications. See notification preferences.
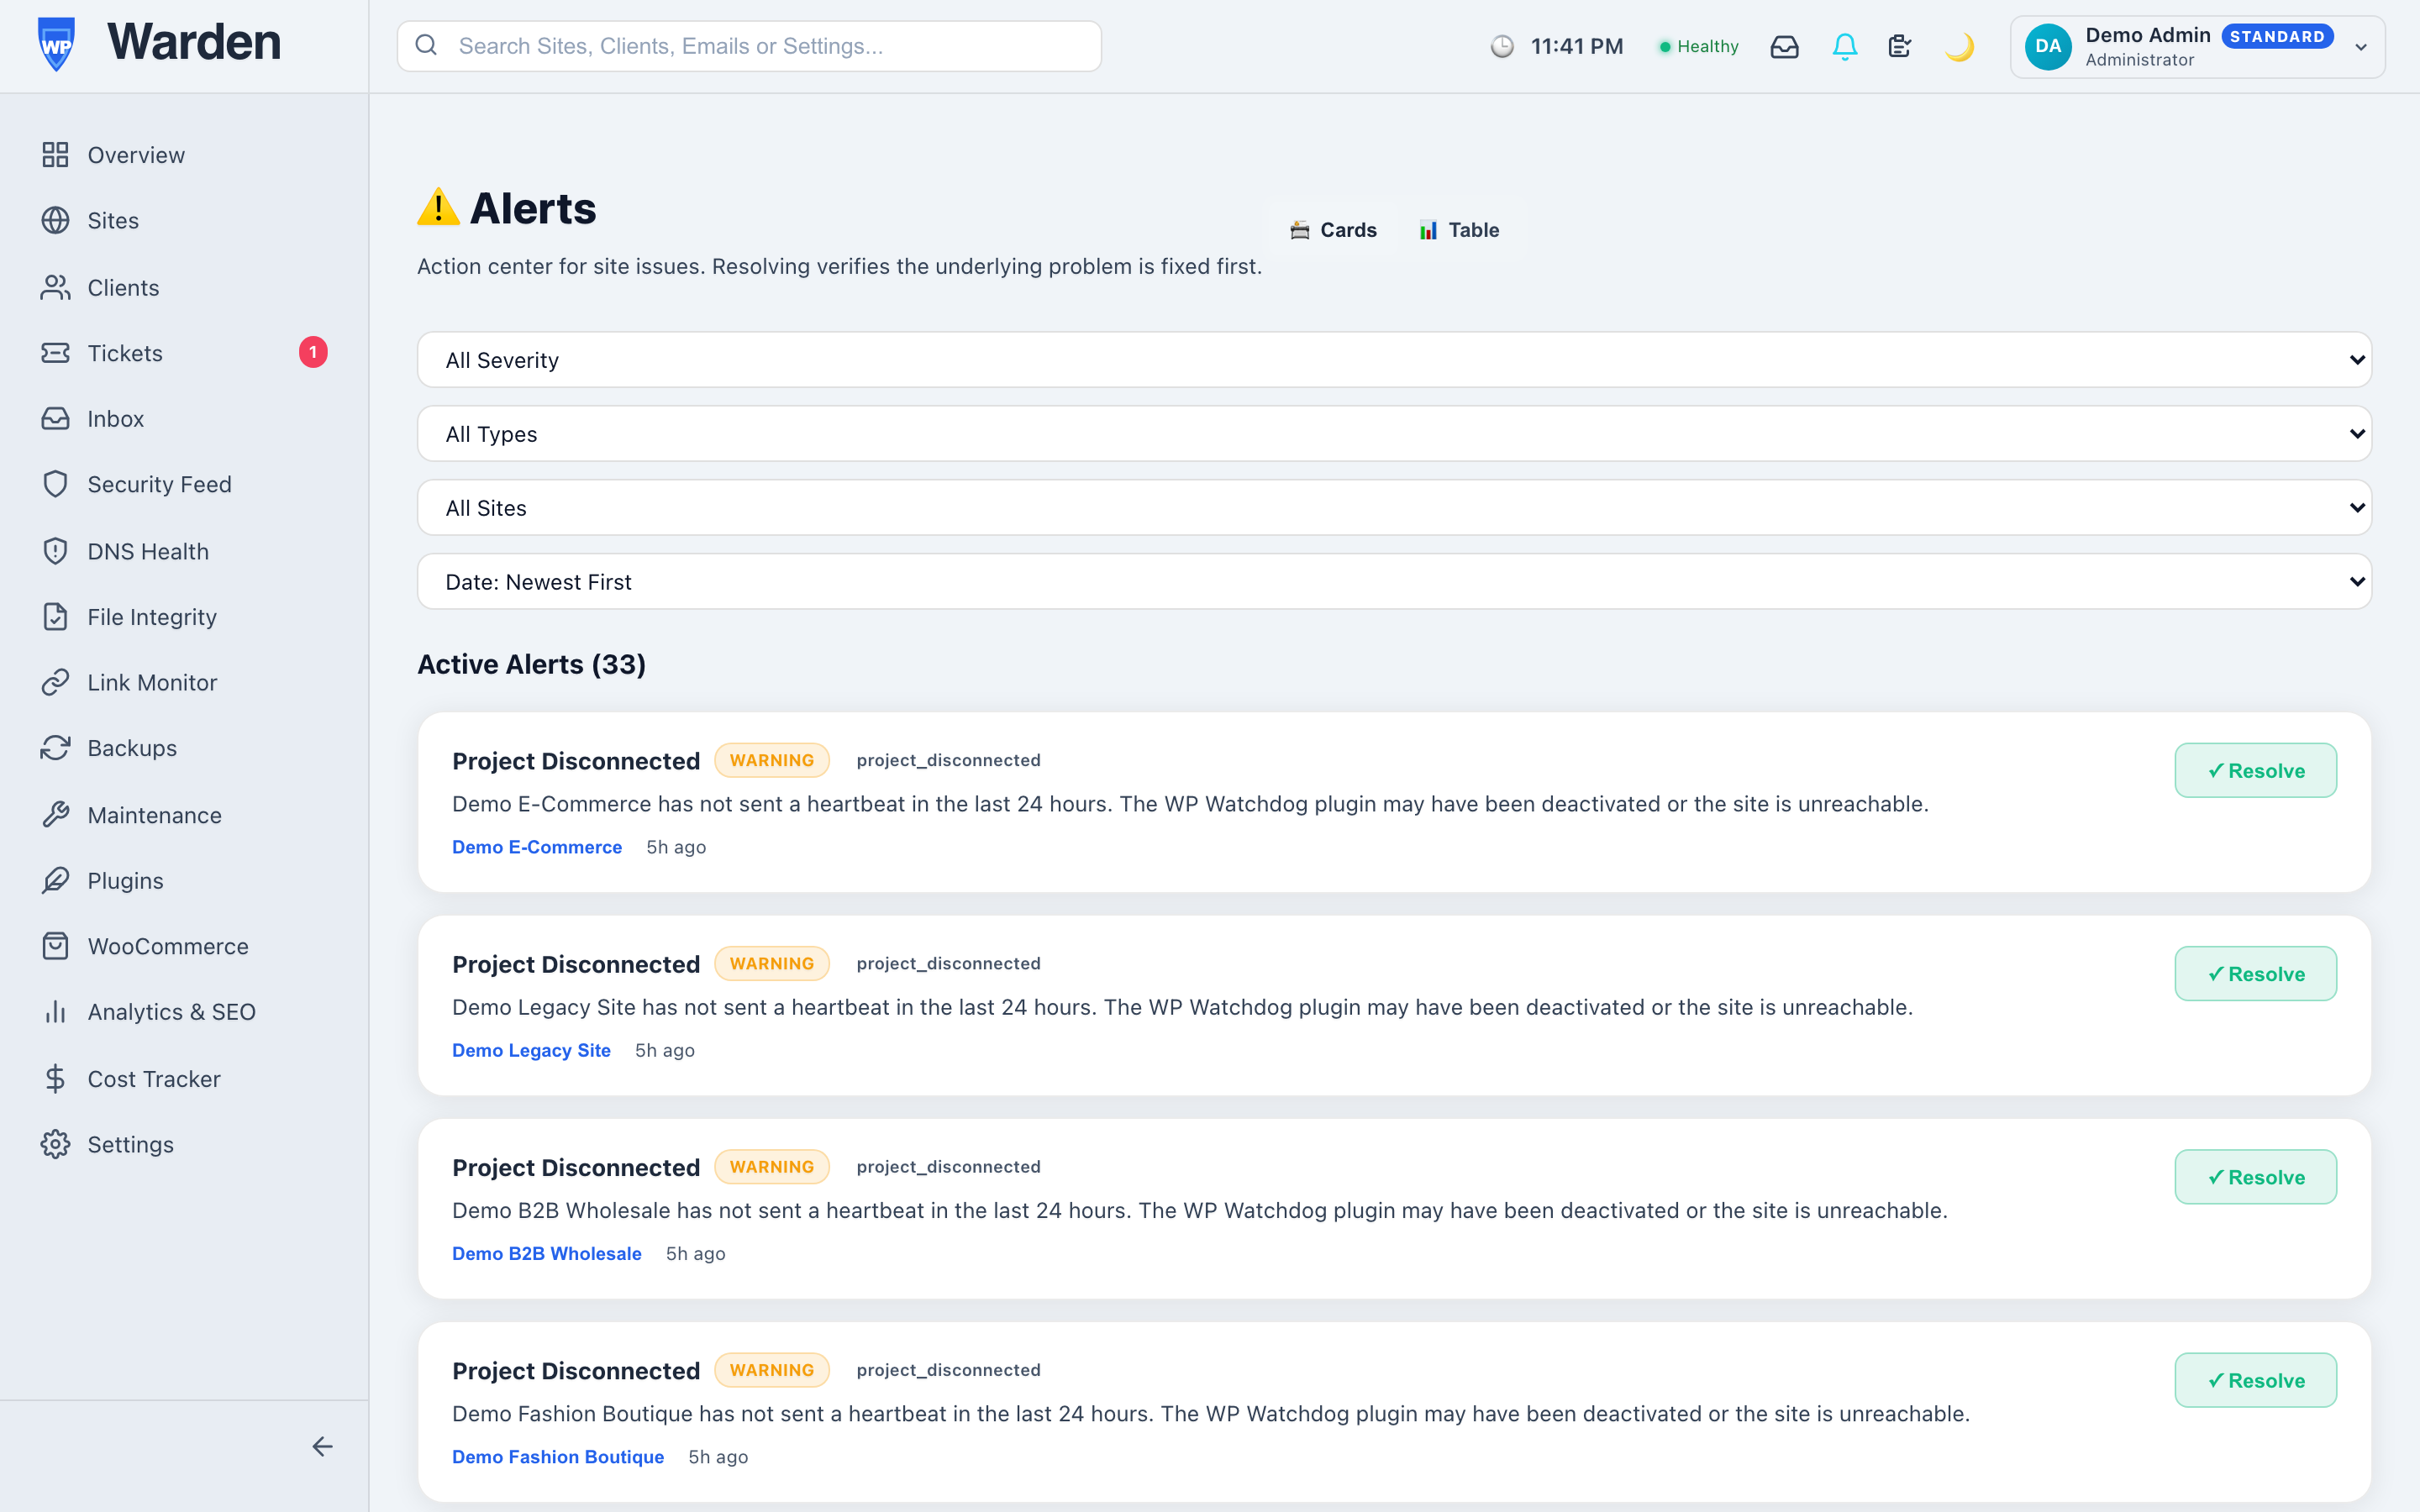 Screenshot: Alerts page with severity filter and Resolve
button
Screenshot: Alerts page with severity filter and Resolve
button
The alerts list with severity color-coding (red border = critical, amber = warning, blue = info), filter dropdowns, and per-row Resolve and Snooze buttons.
WP Warden deduplicates alerts — if the same cron hook misses again on the next engine run, no second alert is created for the same issue on the same site.
Unresolved Critical and Warning alerts generate hourly follow-up emails until they are resolved or acknowledged. This is configurable in Settings → Notifications.
How to monitor DNS health
InfrastructureWP Warden checks DNS records, SSL certificates, email authentication (SPF, DKIM, DMARC), and global DNS propagation for all your sites every 6 hours and alerts you when something changes.
-
Go to DNS Health
Click DNS Health in the sidebar to see the fleet-wide DNS overview. -
Review the DNS health scores
Each site has a 0–100 DNS Health Score based on five categories: Email Auth (SPF/DKIM/DMARC), SSL Security, DNS Records (A, MX, Nameservers), Uptime, and Propagation across 6 global resolvers. -
Click a site to see full details
The per-site DNS detail page shows every individual check result — pass, fail, or warning — with timestamps. -
Read fix guides for failed checks
For each failed check, a Fix Guide button appears. Click it for step-by-step remediation instructions including exact DNS record values to copy into your DNS provider. -
Trigger a manual recheck
Click Recheck Now on any site’s DNS detail page to run an immediate check without waiting for the 6-hour scheduled run. Rate-limited to once per 10 minutes.
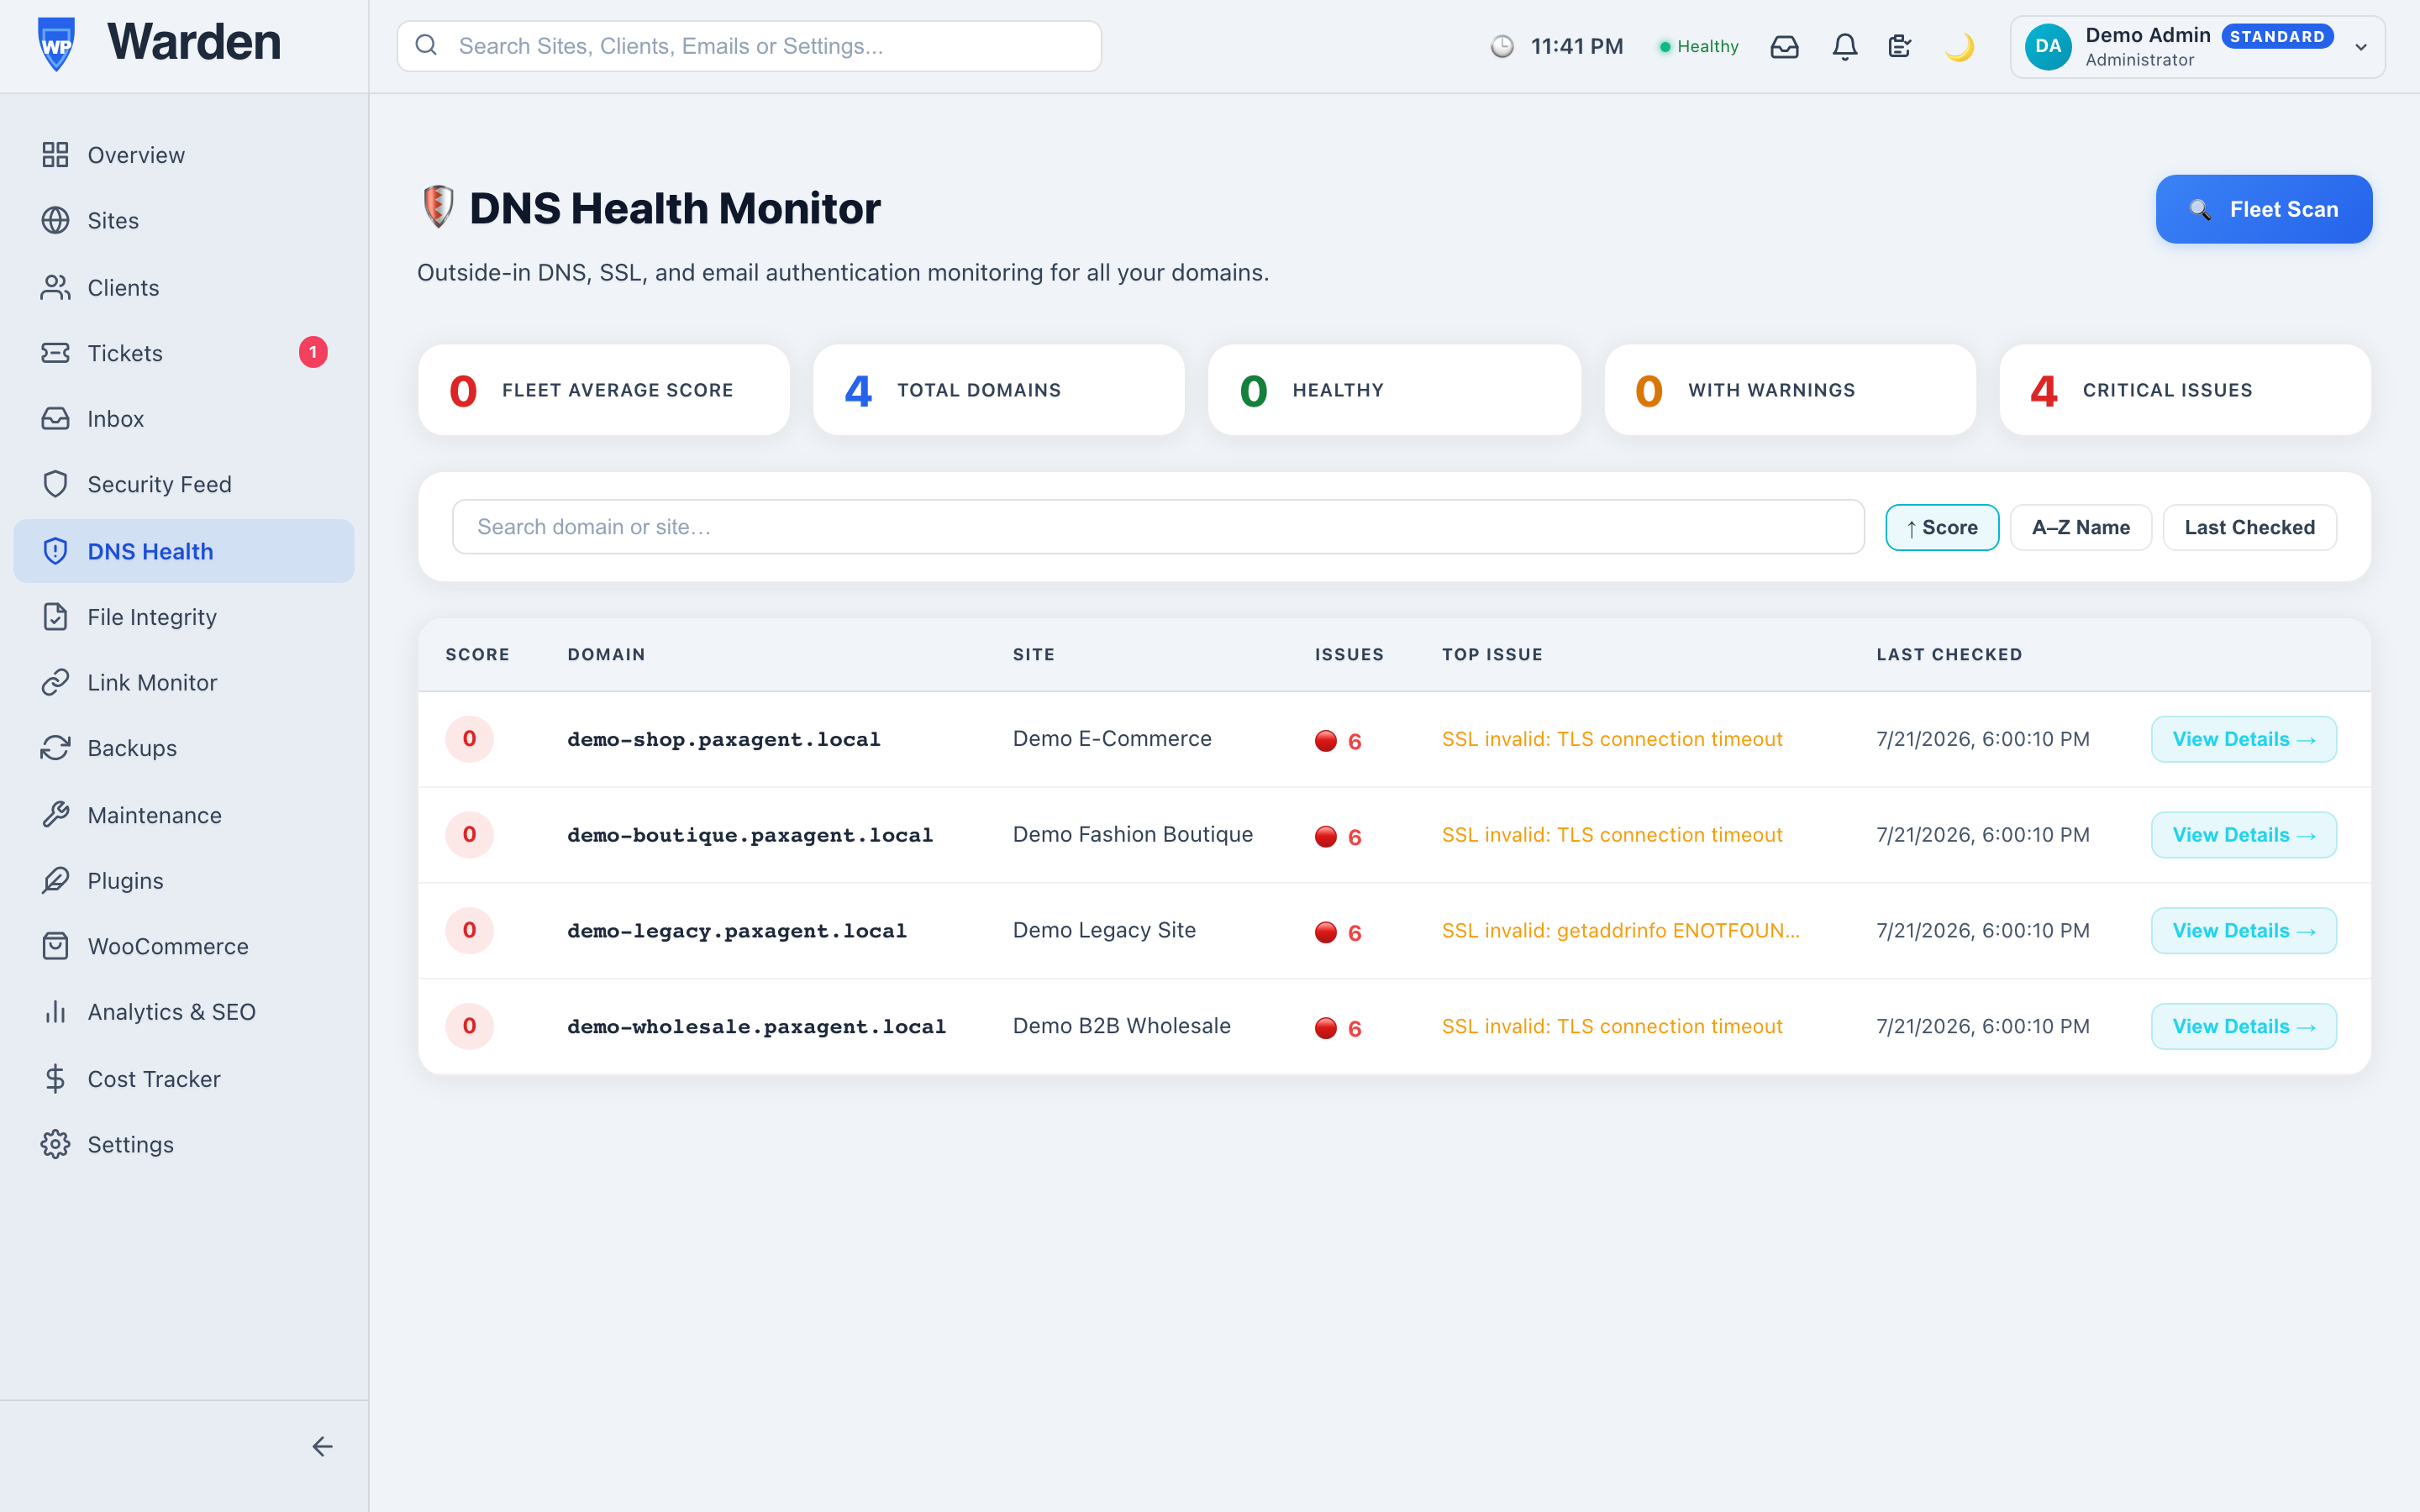 Screenshot: DNS Health fleet overview
The fleet table showing each site’s DNS score, category breakdown bars, and last check time.
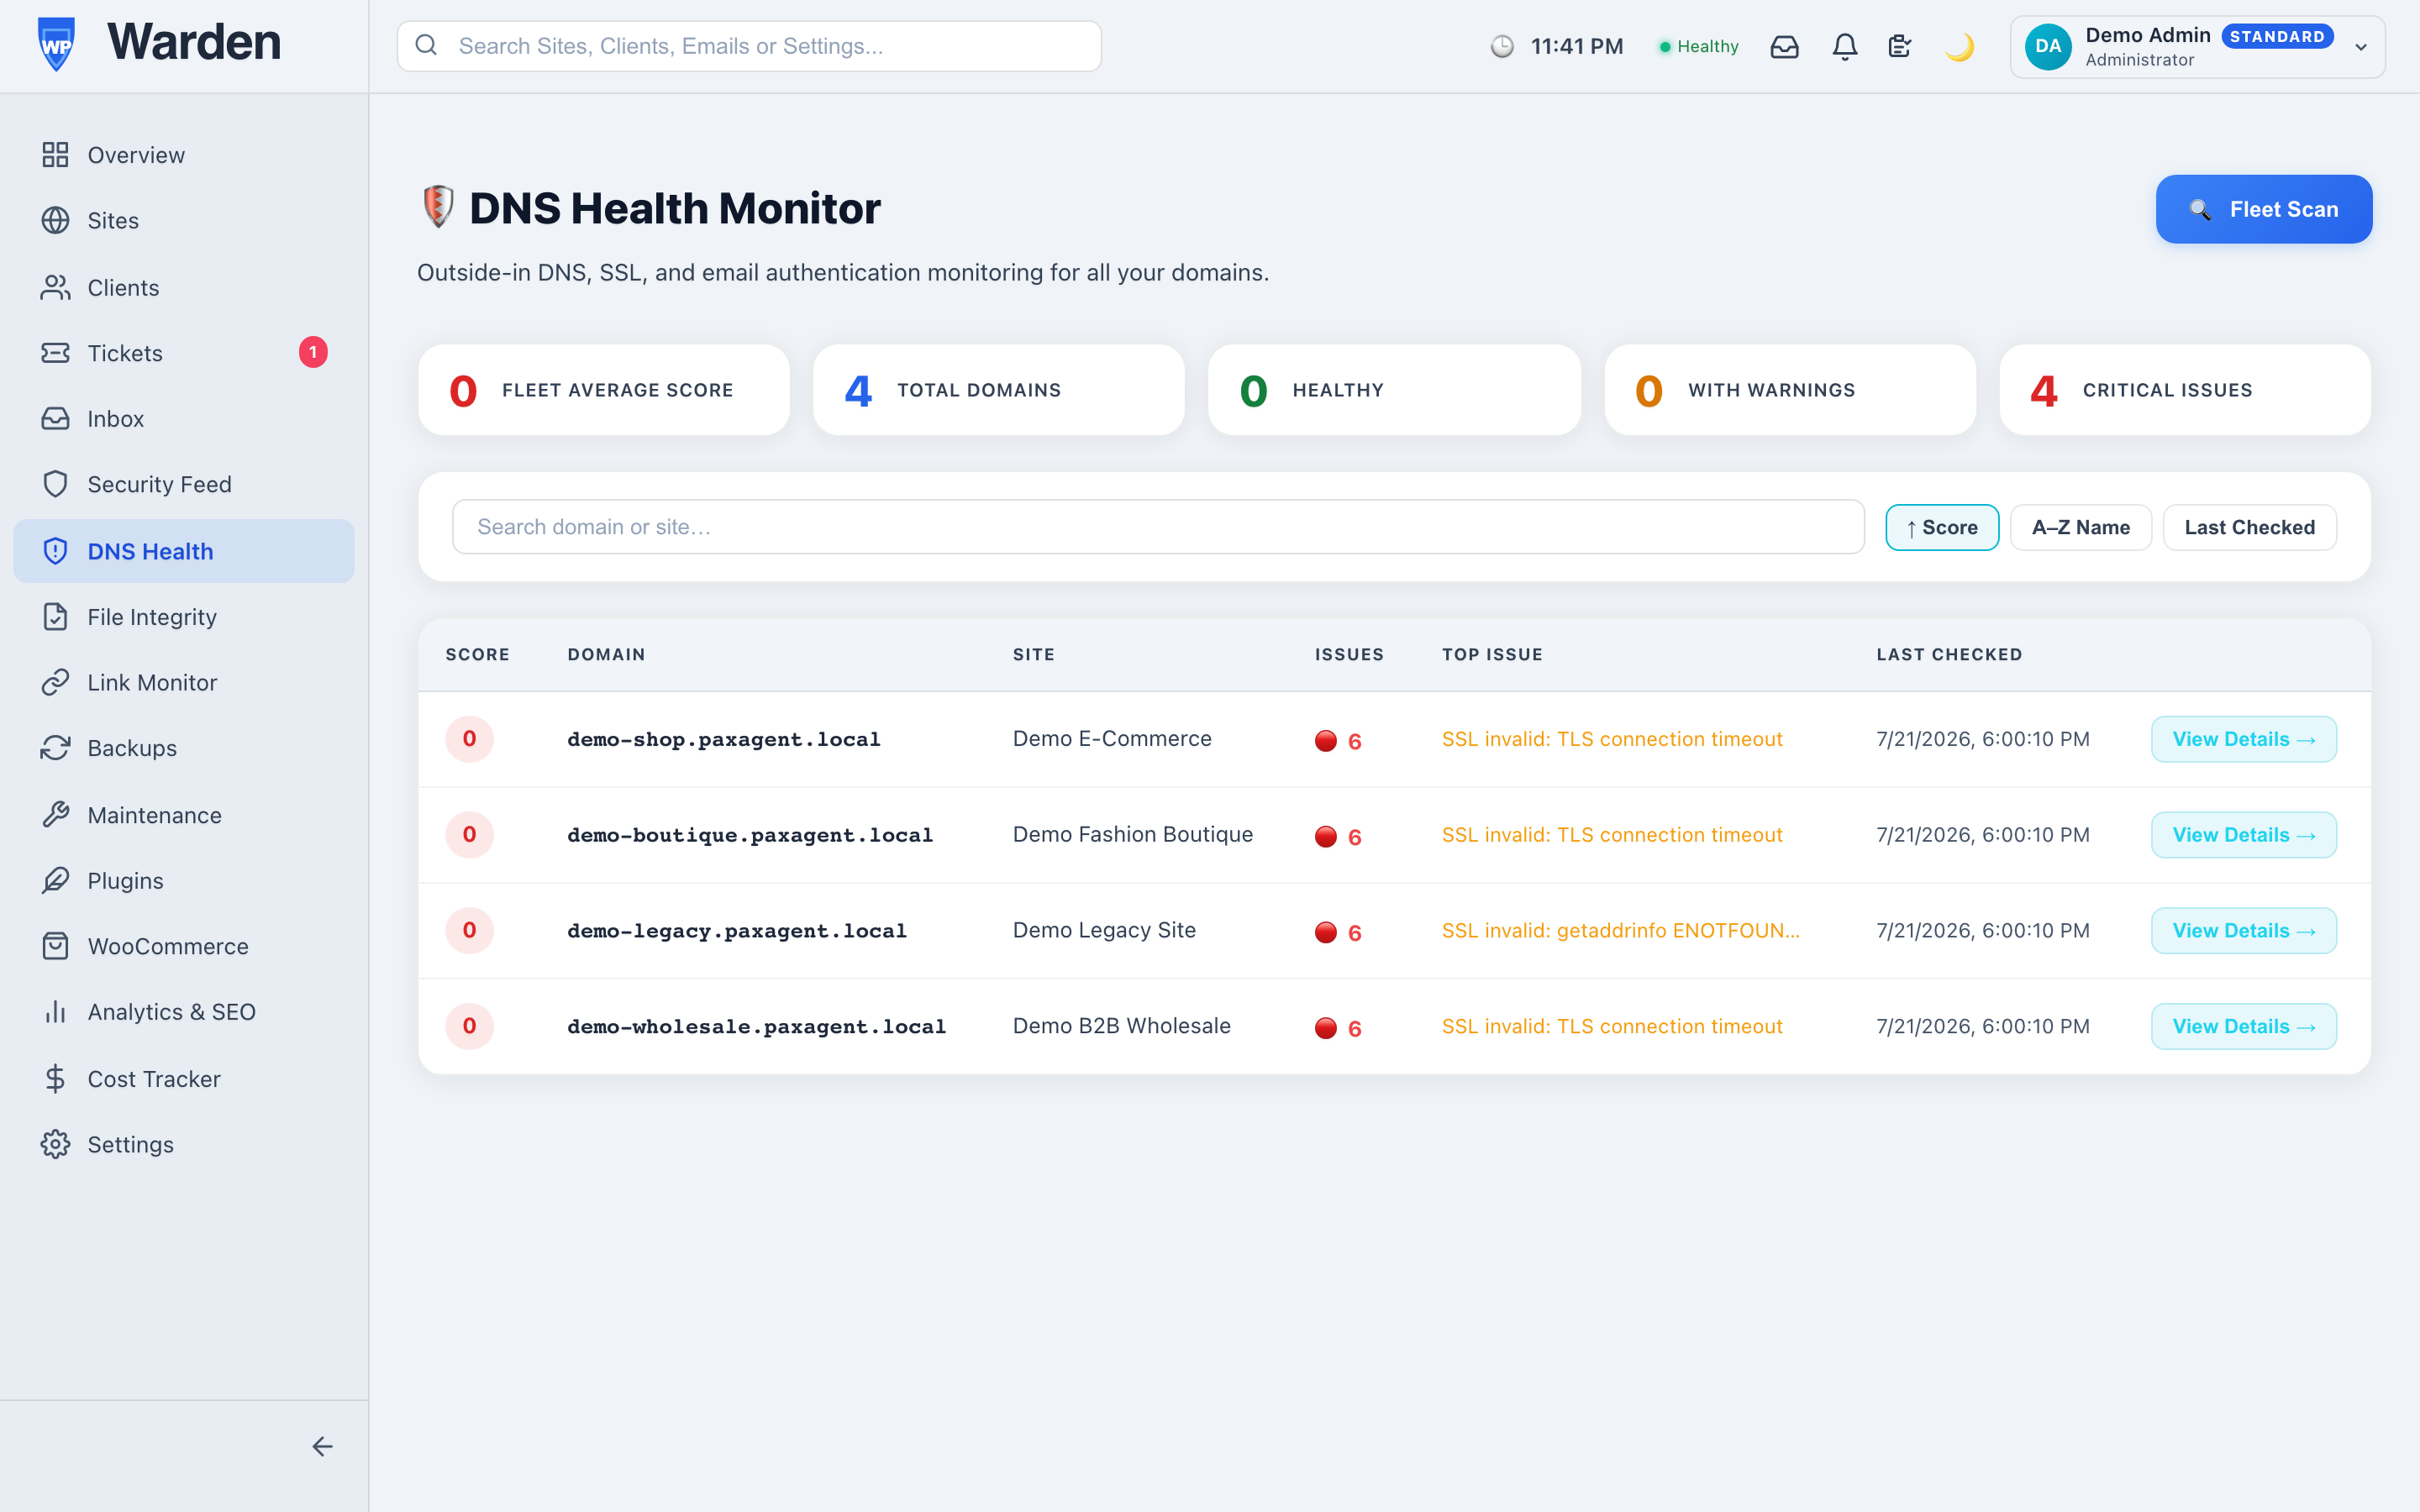 Screenshot: Per-site DNS detail page
Individual check results for A record, MX, SPF, DKIM, DMARC, SSL certificate expiry, and propagation across 6 resolvers.
A missing DMARC or SPF record triggers a Critical alert because it leaves your domain open to email spoofing. Use the Fix Guide to add the correct records in under 5 minutes.
How to monitor uptime and downtime
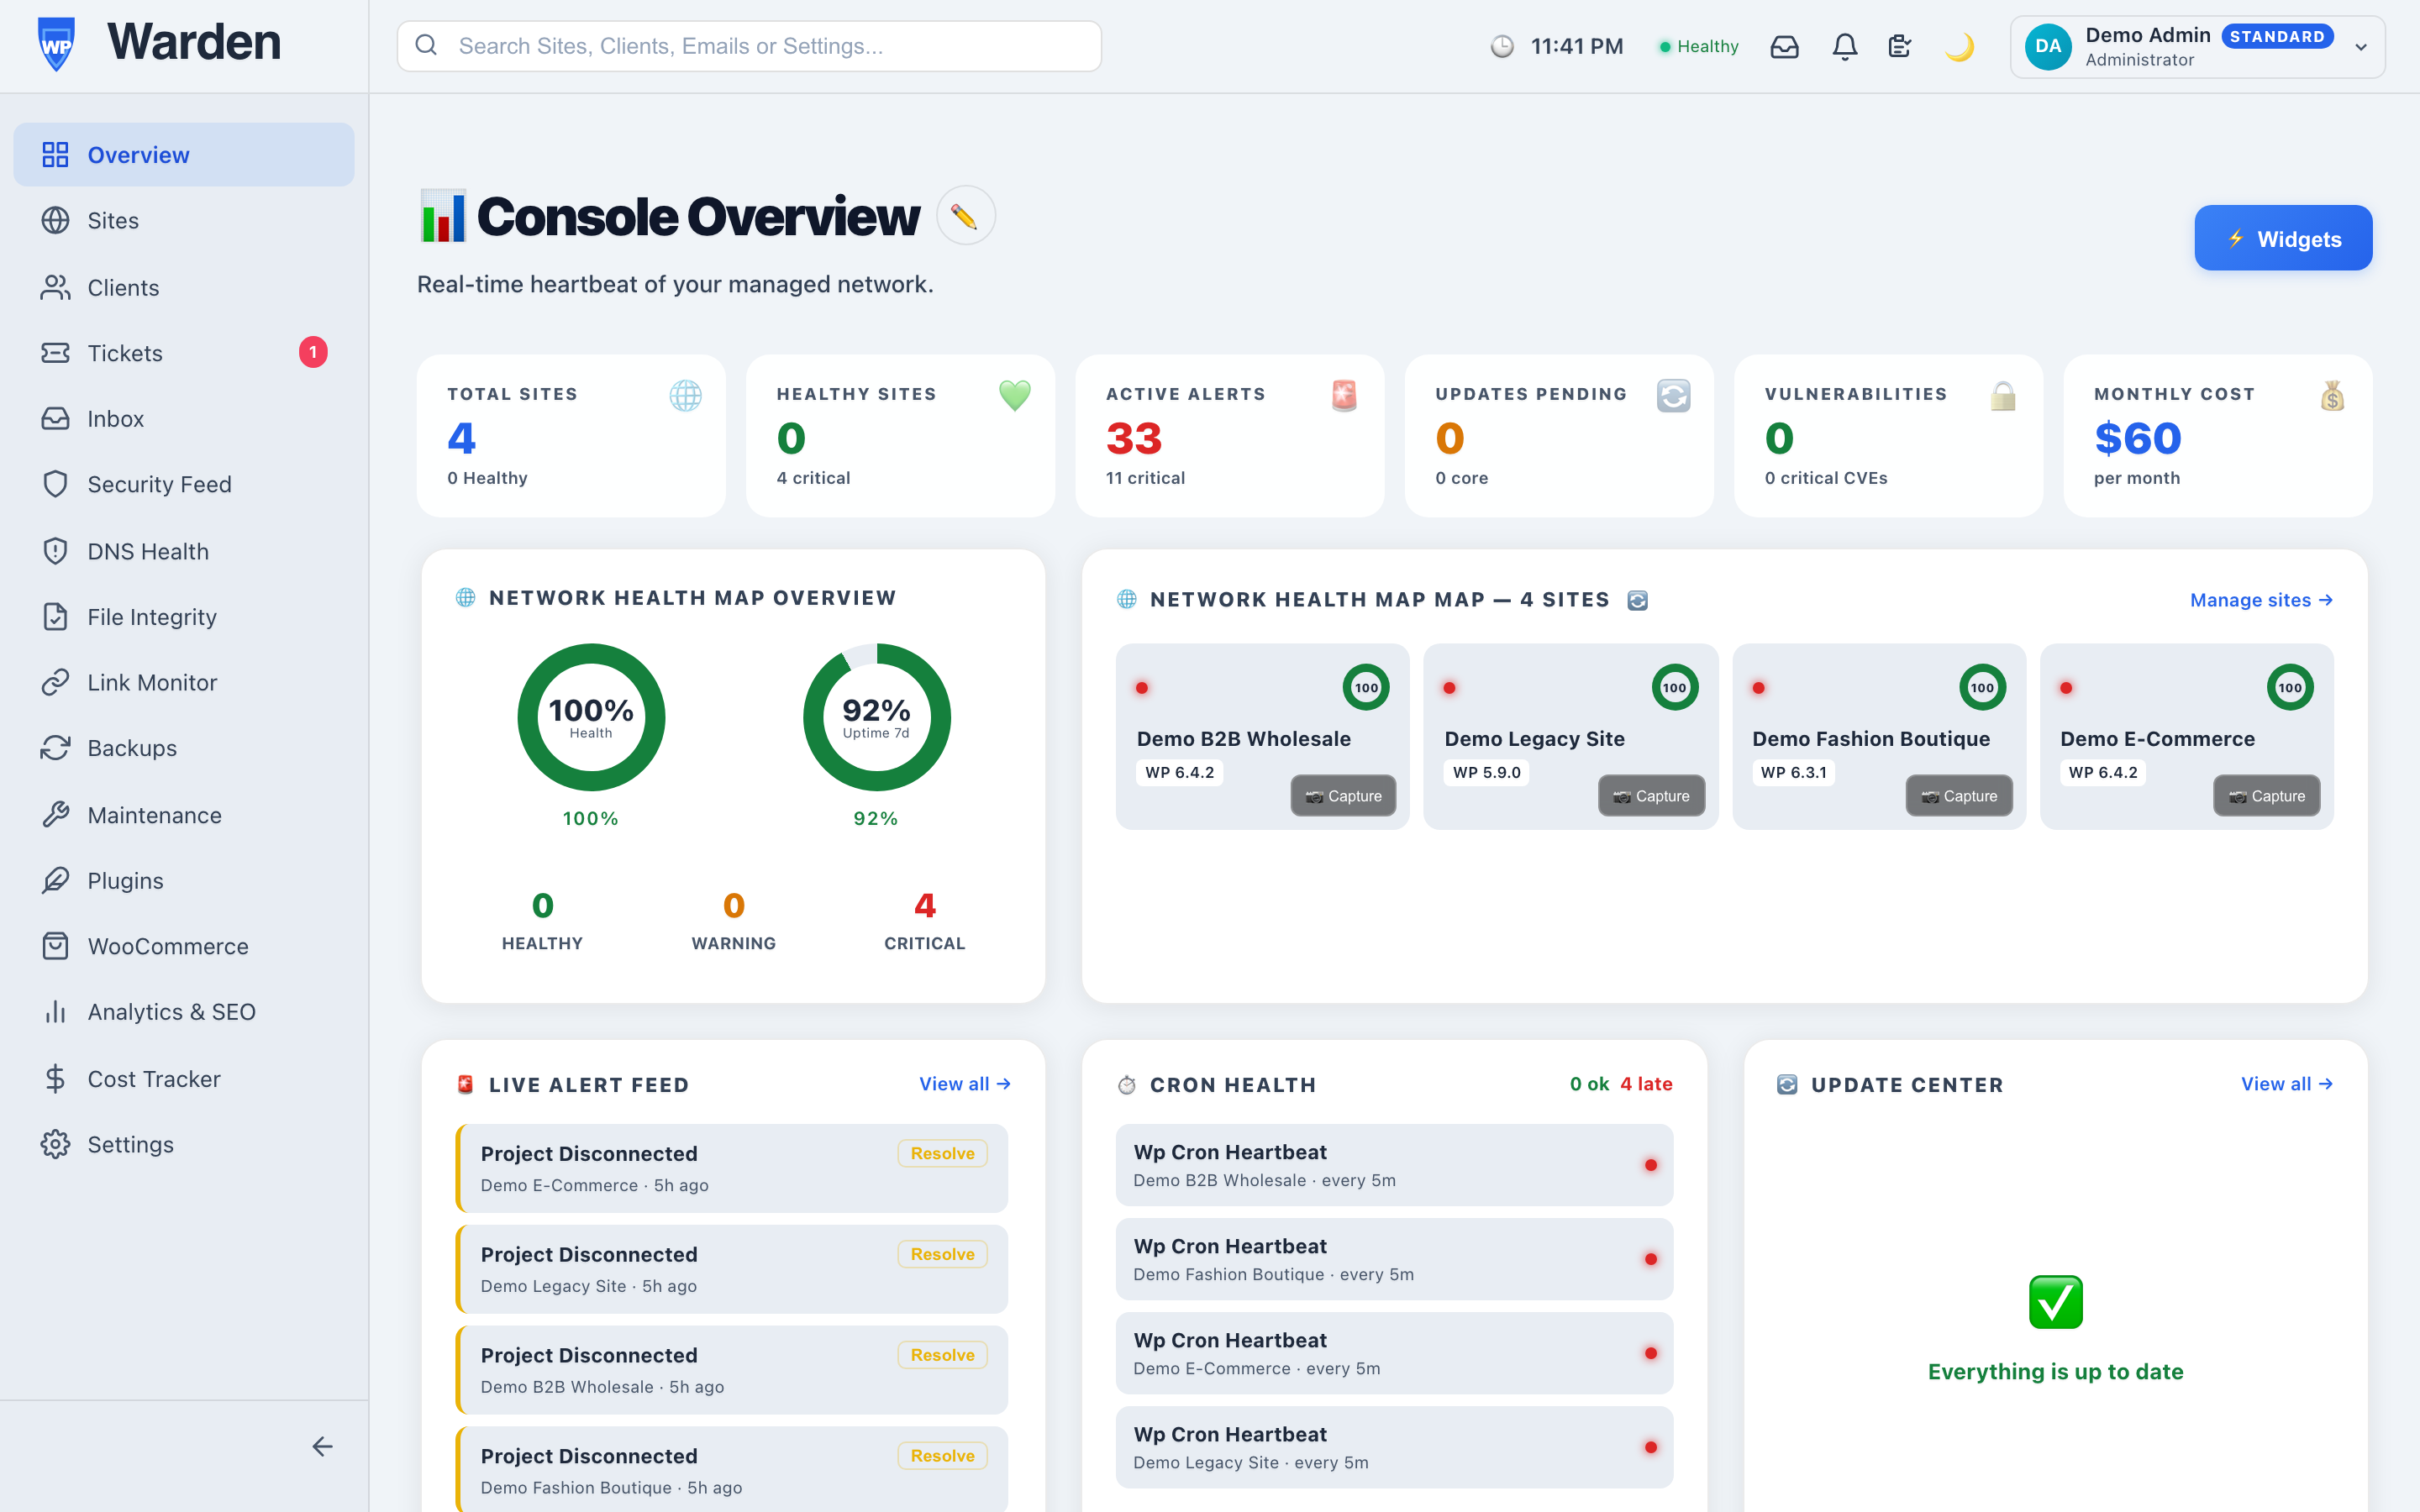
AvailabilityWP Warden probes every site every 5 minutes from the backend server, completely independent of the WordPress plugin. When a site goes down you get an alert instantly — not on the next heartbeat.
-
Uptime monitoring is automatic
No setup required. Every site you add to WP Warden is automatically included in the 5-minute uptime probe cycle. -
View uptime statistics
Open any site’s detail page and scroll to the 30-Day Health Trend chart, which overlays response time as an amber dashed line alongside the health and security score trends. Hover any point for the exact response time at that check. -
View downtime incidents
When a site was down, downtime incidents are recorded with: start time, end time, duration, and root cause (DNS failure, timeout, connection refused, HTTP 5xx). These appear in the Uptime section of client reports. -
Check the active alert when a site is down
Go to Alerts. A Site Unreachable critical alert is created automatically the moment a probe fails. The alert is automatically resolved when the site comes back up — no manual action needed.
 Screenshot: Site detail page — 30-Day Health Trend
chart
Screenshot: Site detail page — 30-Day Health Trend
chart
The interactive sparkline chart showing health score (green), security score (blue), and response time (amber dashed) over 30 days.
Uptime statistics (7-day, 30-day, and 90-day %) appear in the Availability & Uptime section of client reports — a great way to demonstrate your service reliability.
How to view visual regression results
Quality ControlEvery time WP Warden applies a plugin, theme, or core update, it automatically captures before/after screenshots and compares them pixel by pixel. If the site looks different, you get a Visual Regression alert.
-
Visual regression runs automatically after updates
No configuration needed. Whenever an update command is executed via WP Warden (toggle, bulk update, or maintenance window), a before-screenshot is captured, then a second after-screenshot is taken, and the two are diff’d. -
Check for Visual Regression alerts
If the pixel mismatch exceeds the threshold (default 5%), a Visual Regression warning alert appears in the Alerts page. Click it for details. -
View the before/after images
Open a site’s detail page and go to the Regressions tab. Each entry shows the diff score (%), and you can click to view the before screenshot, after screenshot, and the red-highlighted diff image side by side. -
Investigate the change
A high diff score means something visible changed on the homepage. This could be a legitimate UI update or an unintended breakage. Open the site in a browser to confirm. -
Resolve the alert
Once you have confirmed the change is expected (or fixed the issue), return to Alerts and click Resolve on the visual regression alert.
 Screenshot: Visual Regression — before/after/diff
view
Screenshot: Visual Regression — before/after/diff
view
Three screenshots side by side: before the update, after the update, and the pixelmatch diff image with red-highlighted changed areas.
The sensitivity threshold defaults to a 5% pixel difference before an alert triggers — tuned to catch real layout breaks without flagging normal, minor rendering differences.
Screenshots are captured at 1280×900 viewport after waiting for the page to fully load. They are stored securely and accessible only to authenticated users of your account.
How to monitor file integrity & block malware
Malware DefenseWP Warden hashes every core, plugin, and theme file and diffs it against a known-good baseline, and separately scans for malicious code patterns and blocks brute-force logins — so a compromise gets caught whether it shows up as an unexpected file change or as a webshell that was never a “change” at all.
-
Hash-based change detection (core, plugins, themes)
Every file in scope is SHA-256 hashed on each scan and compared to the last known-good baseline. Core files are additionally cross-checked against the official WordPress.org checksum manifest, so tampering is caught even on the very first scan. -
Malware & webshell signature scanning
Independent of hash diffing, WP Warden scans file content for known malicious-code patterns — obfuscatedeval()/base64_decode()chains, dynamic function construction, and webshell request patterns. This catches a webshell even if it was already present before monitoring started, which a hash baseline alone cannot. -
Uploads directory coverage
wp-content/uploadsis excluded from hash-diff baselining (it changes constantly by design) but is still scanned for disallowed executable extensions and malicious content — the single most common place a dropped webshell hides. -
Uploads directory hardening
The WP Warden plugin pushes a server rule intowp-content/uploadsdenying execution of PHP and other script extensions, so even a file that slips past scanning can’t be run directly. -
Brute-force login protection
Repeated failed logins from the same IP are rate-limited and locked out automatically. If the same IP targets multiple sites in your fleet within an hour, WP Warden raises one fleet-wide alert instead of one alert per site. -
Configure scan scope and review flagged files
Open a site’s File Integrity page to set scan scope (core only, core + plugins, core + themes, or all) and frequency (daily or hourly), and review every modified, added, deleted, or content-flagged file with its matched pattern. -
Execution hardening for other directories & plugins
The same verified deny-execution technique used for uploads extends towp-content/cache,wp-content/upgrade, and direct access towp-includes— enable each from the same File Integrity page. Individual plugins can also be hardened as an opt-in: WP Warden runs a pre-flight risk scan first, then a trial period that automatically reverts if you don’t explicitly confirm it or if the site’s health score drops.
A critical alert on a content-flagged file means WP Warden found a known malicious-code pattern, not just a change — review it immediately rather than whitelisting it.
A backup taken right after a fully clean scan is marked Verified Clean in the Backups page — the safest restore point to roll back to after a compromise.
How to harden directories & plugins against execution
Malware DefenseExecution Hardening stops a planted file — a dropped webshell, a backdoor an attacker uploaded — from ever running as PHP, even if it makes it onto your server. It does this by denying direct execution in a directory or plugin folder, then immediately verifying the rule actually works with a live test request, rather than just assuming a written rule took effect.
-
Deny-execution, not file locking
WP Warden adds a server rule (.htaccess) denying direct execution of code-like files in the target location. This is deliberately not permission-based (chmod) locking: a same-owner attacker process can chmod its own file back, and WordPress’s own plugin/theme updater deletes and recreates whole directories on update regardless of any per-file permission. Denying execution sidesteps both problems — it doesn’t matter whether a file gets modified or a new one gets dropped, because nothing in that location can ever run as PHP in the first place. -
Live-verified, never just assumed
Some hosts (Nginx, or Apache with.htaccesssupport disabled) silently ignore these rules. After applying, WP Warden drops a probe file and makes a real HTTP request to it — the status you see always reflects what an actual request would experience, never just “the rule file exists.” -
Four curated directories, low risk
wp-content/uploads,wp-content/cache,wp-content/upgrade, andwp-includes— none of these legitimately need to serve a PHP file directly, so toggling hardening on for any of them from a site’s File Integrity page has essentially no downside. -
Plugin hardening is opt-in and higher-risk
Some plugins genuinely need a directly-hittable file — a payment gateway callback, a license check, a webhook receiver. Hardening a plugin that relies on one of those will break that specific feature, which is why plugin-level hardening always goes through Scan → Apply → Confirm rather than applying blind. -
Scan for risk before applying
A heads-up scan (not an exhaustive audit) flags files whose name suggests they expect a direct hit — matching patterns likecallback,webhook,ipn,license, orgateway. Review every flagged file before continuing. -
Trial period with automatic rollback
Applying a plugin hardening starts a 48-hour trial. If your site goes down, or its health score drops meaningfully, during that window, WP Warden automatically reverts it as a precaution — you don’t have to notice and fix it yourself. An unconfirmed trial always auto-reverts once it expires; hardening never silently becomes permanent on its own. You can also revert manually at any time, for any reason. -
Requires the site to be online
Every hardening action needs your site reachable to actually take effect and be verified. If WP Warden can’t reach your site when you trigger an action, it tells you immediately instead of queuing something that could never complete. If a site goes offline while a plugin hardening is mid-trial, that trial is automatically reverted as a safety precaution once WP Warden notices.
Before applying plugin-level hardening, always review the risk scan’s flagged files — a plugin with a payment callback, license check, or webhook endpoint will lose that specific functionality once hardened.
Execution Hardening only controls whether a file can run — it isn’t a malware scanner. Pair it with the file-integrity scan above, which is what actually detects malicious code.
How to get an AI second opinion on flagged files
Malware DefenseWhen the file-integrity scanner flags a file, you can optionally connect your own AI provider — Claude, ChatGPT, Gemini, or a locally-hosted model — for an independent second opinion before deciding what to do about it.
-
Connect your AI provider
Go to Settings → AI Security. Toggle it on, choose a provider (Claude, ChatGPT, Gemini, or Local / OpenAI-compatible for something like LM Studio or Ollama), and enter your API key — or, for a local server, its URL (e.g.http://localhost:1234/v1). No API key is needed for a local server. -
Don’t have a key yet?
Create one in your own account on the provider’s own site — WP Warden doesn’t issue these: Anthropic (Claude) — “Get your API key” · OpenAI (ChatGPT) — API keys · Google AI Studio (Gemini) — API keys. WP Warden only ever sees the key you paste in, never your provider account credentials. -
Choose which locations the AI can see
Turn Core, Themes, Plugins, mu-plugins, and Uploads on or off independently. Only files inside an enabled zone are ever sent for a second opinion — nothing is scanned proactively, only files the deterministic scanner already flagged. -
Set a daily call limit
Cap how many findings per day get sent to your AI, so your own usage costs with that provider stay predictable. -
Test the connection
Click Test Connection to confirm WP Warden can reach your provider (or local server) and get a real response back before relying on it. -
Review AI verdicts on flagged files
Open a site’s File Integrity page. A finding that has completed AI review shows a colored 🤖 badge — malicious, benign, or uncertain — with the AI’s rationale on hover. -
Quarantine or permanently delete a confirmed threat
Click Quarantine on site to rename and lock the file in place on the live site — reversible, evidence preserved. Once quarantined, a separate Permanently delete button appears as a deliberate second step. -
Track your usage
Settings → AI Security shows token usage for today, this month, and all time, so you can see roughly what you’re spending with your own provider.
This is bring-your-own-key: WP Warden never sees or bills for your AI usage — every call goes directly between your account and your chosen provider.
A local model (via LM Studio, Ollama, or any OpenAI-compatible server) works too, and costs nothing per call beyond your own hardware — a good option if you want a second opinion without a cloud subscription.
The AI’s verdict is a second opinion, not an automatic action — nothing is quarantined or deleted without you clicking the corresponding button yourself.